
Neonatal GI Physiology & NEC
Session: Neonatal GI Physiology & NEC 3
 photo")
Maggie L. Aucoin, MD (she/her/hers)
Fellow
McGovern Medical School at the University of Texas Health Science Center at Houston
Houston, Texas, United States
.png) Figure 1. Volcano plot of differential gene expression in NEC infants vs. controls. NanoString analysis demonstrated significant upregulation of innate immune and inflammatory pathway genes. Yellow squares indicate genes associated with the MHC I pathway, while gray circles represent other single genes from the panel. The horizontal dashed line marks the statistical significance threshold (adjusted p-value < 0.05), and vertical blue lines denote the log₂(fold change) cutoffs (log2 fold change ≥ ±1).
Figure 1. Volcano plot of differential gene expression in NEC infants vs. controls. NanoString analysis demonstrated significant upregulation of innate immune and inflammatory pathway genes. Yellow squares indicate genes associated with the MHC I pathway, while gray circles represent other single genes from the panel. The horizontal dashed line marks the statistical significance threshold (adjusted p-value < 0.05), and vertical blue lines denote the log₂(fold change) cutoffs (log2 fold change ≥ ±1).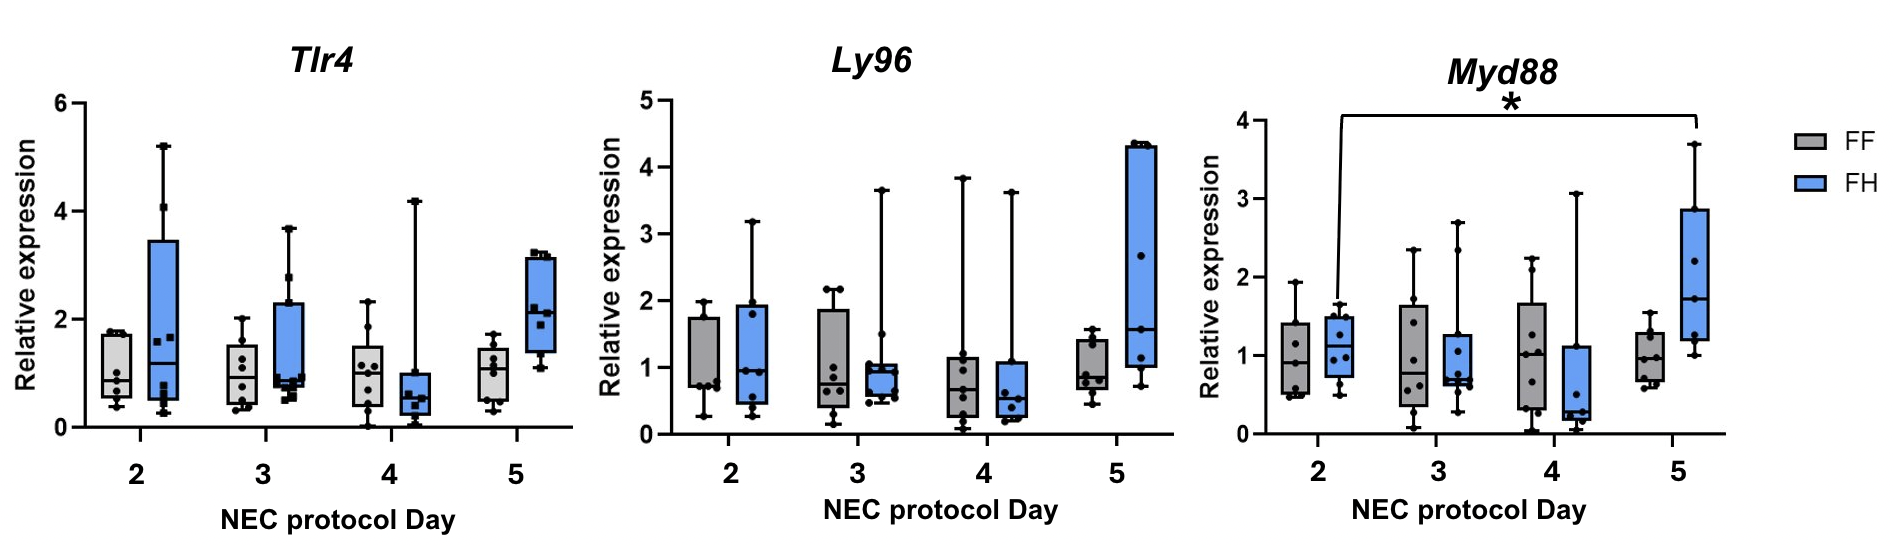 Figure 2. Tlr4, Ly96, and Myd88 expression increased across the five-day protocol, peaking on the final day, in pups exposed to formula/hypoxia/hypothermia compared to formula alone. The overall trend was not significant, except for Myd88, which was higher on day five vs day two (mean difference 0.87, 95% CI 0.05-1.69, p=0.04). FF, formula-fed; FH, formula-fed/hypothermia+/hypoxia.
.png) Figure 3. In the mouse model of experimental NEC, distal ileum histologic score was significantly associated with blood expression of Tlr4 (p < 0.01), Ly96 (p=0.07), and Myd88 (p < 0.01) . Grade 0, normal intestine, Grade 1, epithelial cell lifting or separation, Grade 2, sloughing of epithelial cells to the mid villous level and Grade 3, necrosis of the entire villous.
Figure 3. In the mouse model of experimental NEC, distal ileum histologic score was significantly associated with blood expression of Tlr4 (p < 0.01), Ly96 (p=0.07), and Myd88 (p < 0.01) . Grade 0, normal intestine, Grade 1, epithelial cell lifting or separation, Grade 2, sloughing of epithelial cells to the mid villous level and Grade 3, necrosis of the entire villous. 