
Neonatal Fetal Nutrition & Metabolism
Session: Neonatal Fetal Nutrition & Metabolism 2
Wenona Lok, DO (she/her/hers)
NICU Fellow
Donald and Barbara Zucker School of Medicine at Hofstra/Northwell
New Hyde Park, New York, United States
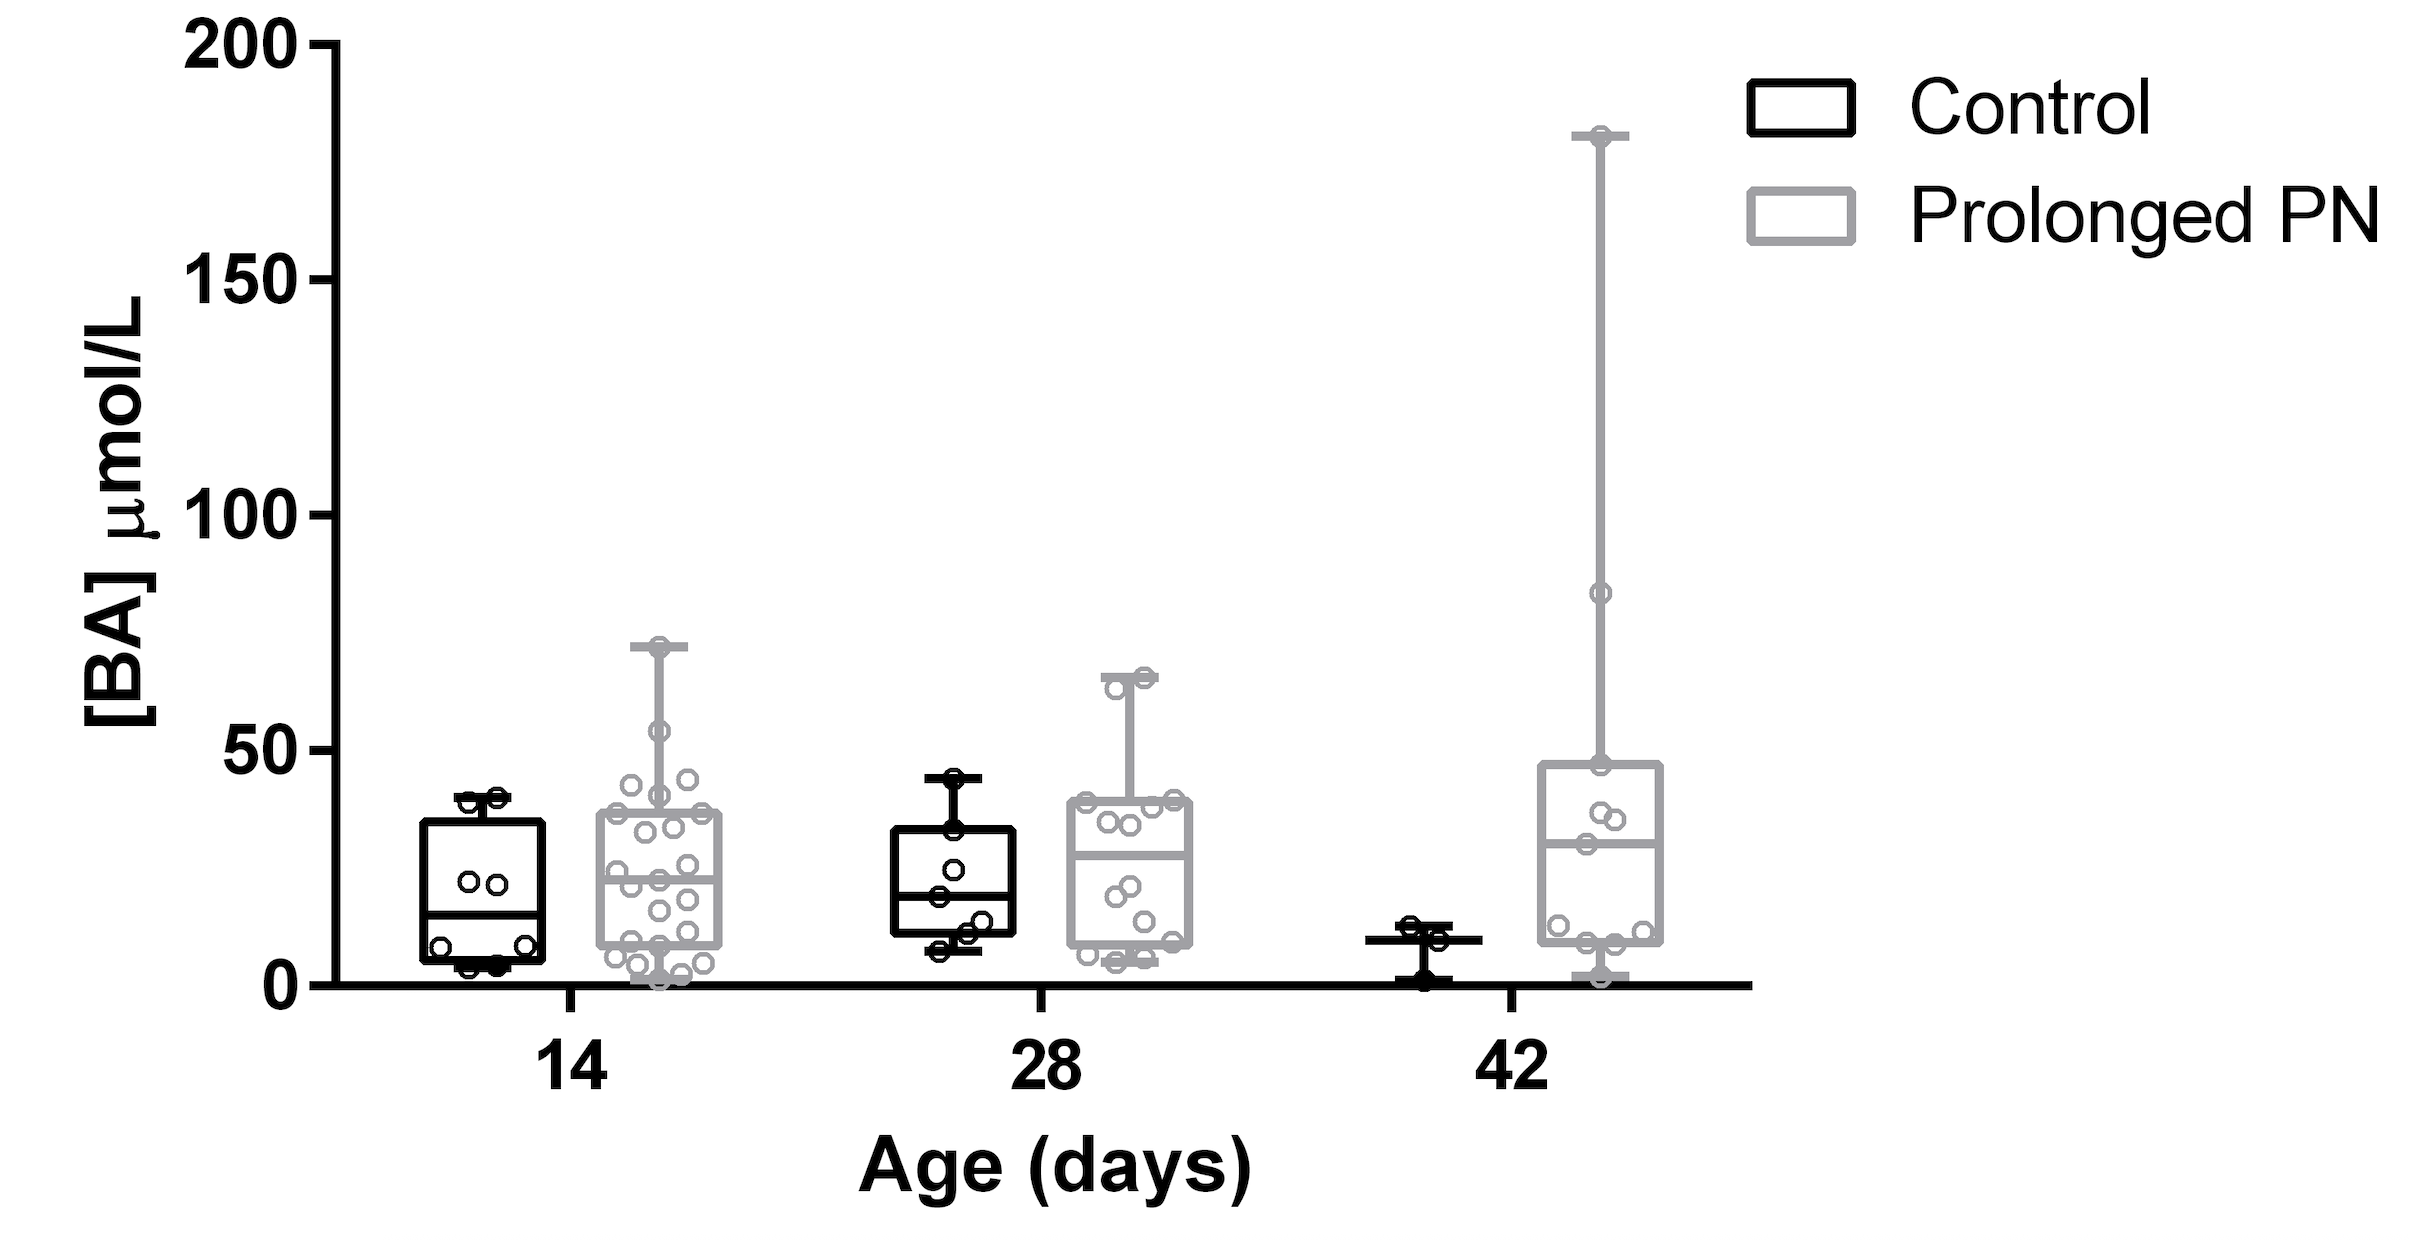 Figure 1. Comparison of bile acid concentrations in serum between infants receiving prolonged parenteral nutrition and controls on day of life 14, 28, and 42. Boxes represent 25th-75th percentiles; line, median; whiskers, range (minimum to maximum).
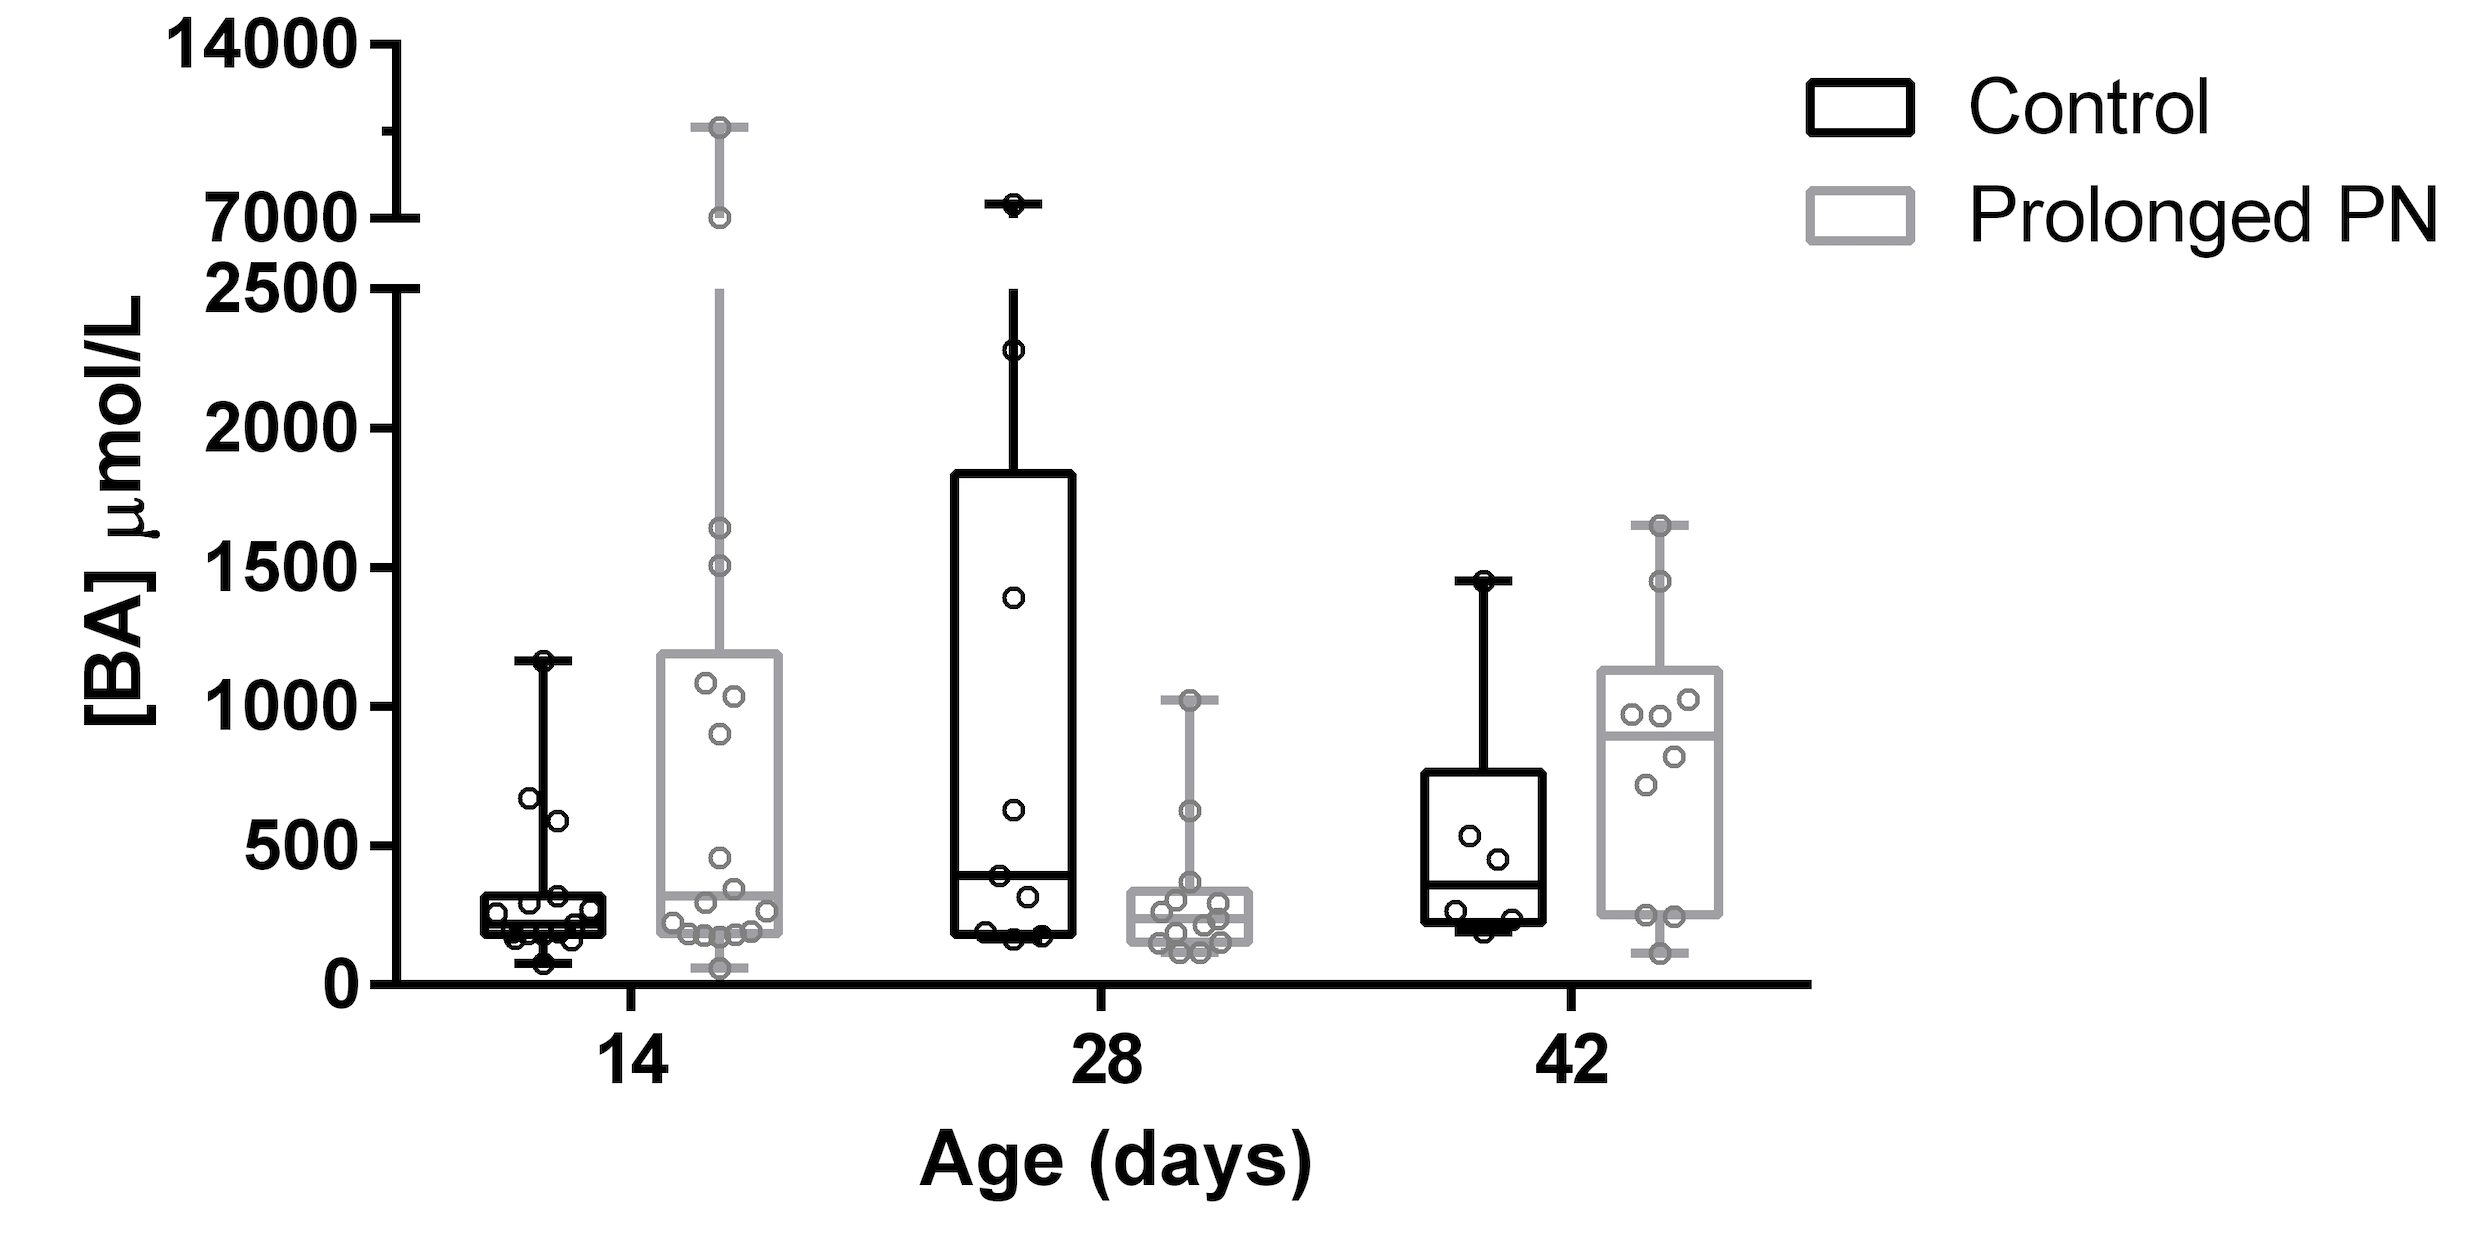 Figure 2. Comparison of bile acid concentrations in stool between infants receiving prolonged parenteral nutrition and controls on day of life 14, 28, and 42. Boxes represent 25th-75th percentiles; line, median; whiskers, range (minimum to maximum).