
Neonatal Quality Improvement
Session: Neonatal Quality Improvement 2
 Credit")
 photo")
Katherine R. French, MD (she/her/hers)
Neonatal Perinatal Medicine Fellow
University of Texas Southwestern Medical School
Dallas, Texas, United States
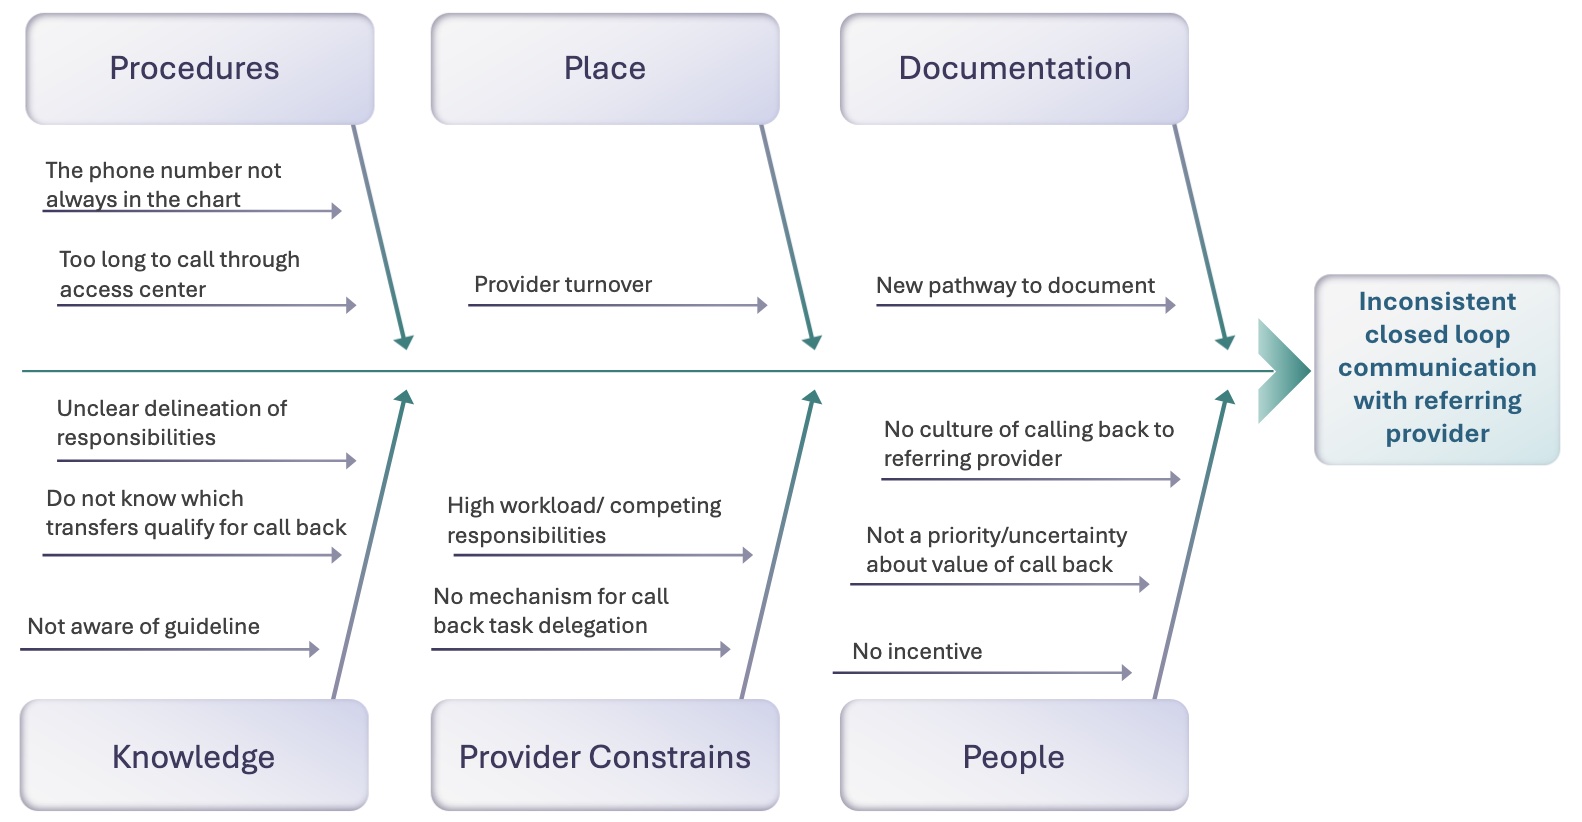 The fishbone diagram demonstrates potential hindering factors to the problem of inconsistent closed loop communication with external referring providers.
 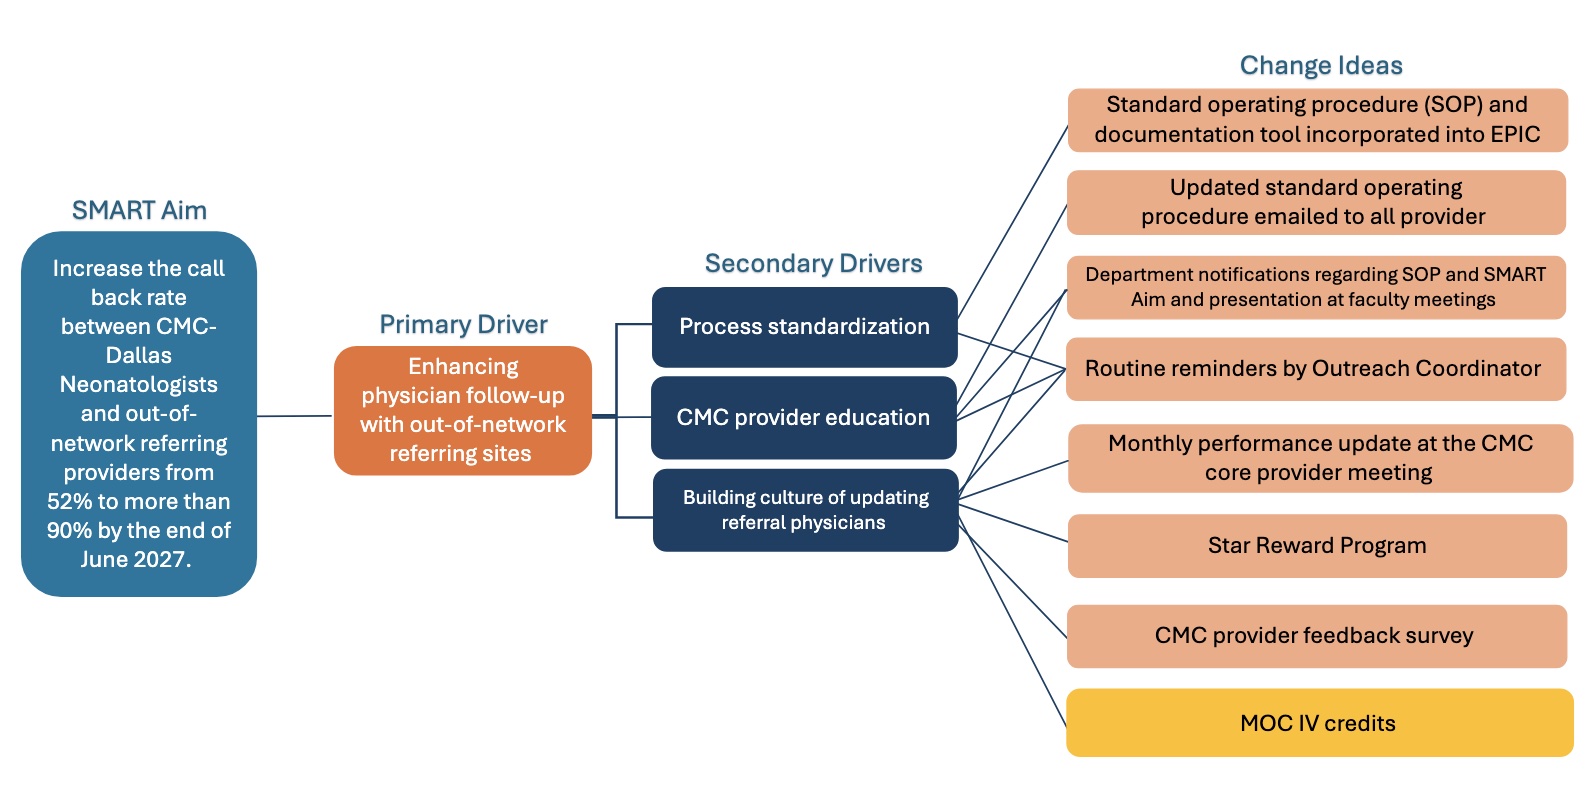 The key driver diagram demonstrates the primary driver, secondary drivers, and change ideas identified for Project REFER. The change idea highlighted in yellow (obtaining MOC IV credits for physician participation) represents an intervention that will be implemented in a future PDSA cycle for the project.
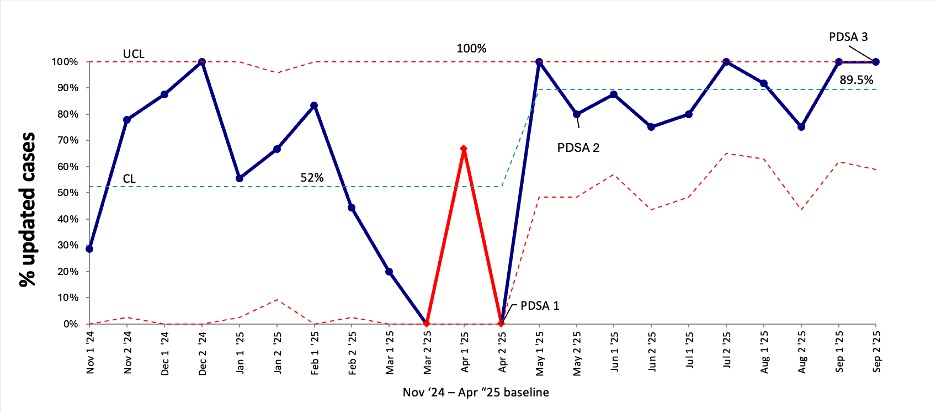 Statistical process control chart (p-chart) tracking the primary outcome over time on a biweekly interval from November 1st, 2024, to September 30th, 2025. The x-axis displays the biweekly time blocks formatted as the first half of the month (example: Nov 1'24) and the second half of the month (example: Nov 2 '24). The y-axis displays the primary outcome measure of percentage of callbacks performed out of the total number of eligible patient transfers. The central line (CL) 52% represents the baseline callback rate prior to the start of Project REFER with favorable upward shift to 89.5% following 2 PDSA cycles.