
Neonatal Bilirubin Metabolism
Session: Neonatal Bilirubin Metabolism
 photo")
Elena Luo (she/her/hers)
Research Assistant
MassGeneral Hospital for Children
Cambridge, Massachusetts, United States
.png) Differences in categorical variables tested using Pearson chi square test, or 1 Fisher's exact test (where cell size < 5)
Differences in categorical variables tested using Pearson chi square test, or 1 Fisher's exact test (where cell size < 5).png)
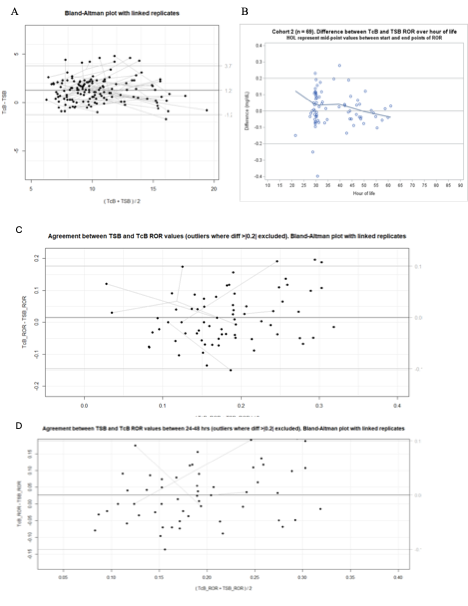 The Bland-Altman plot is a scatter plot where the difference between two measurements is plotted on the y-axis against the average of those measurements on the x-axis.