
Neonatal Fetal Nutrition & Metabolism
Session: Neonatal Fetal Nutrition & Metabolism 2
 photo")
William King, MSEE (he/him/his)
CEO
Medical Predictive Science Corporation
Charlottesville, Virginia, United States
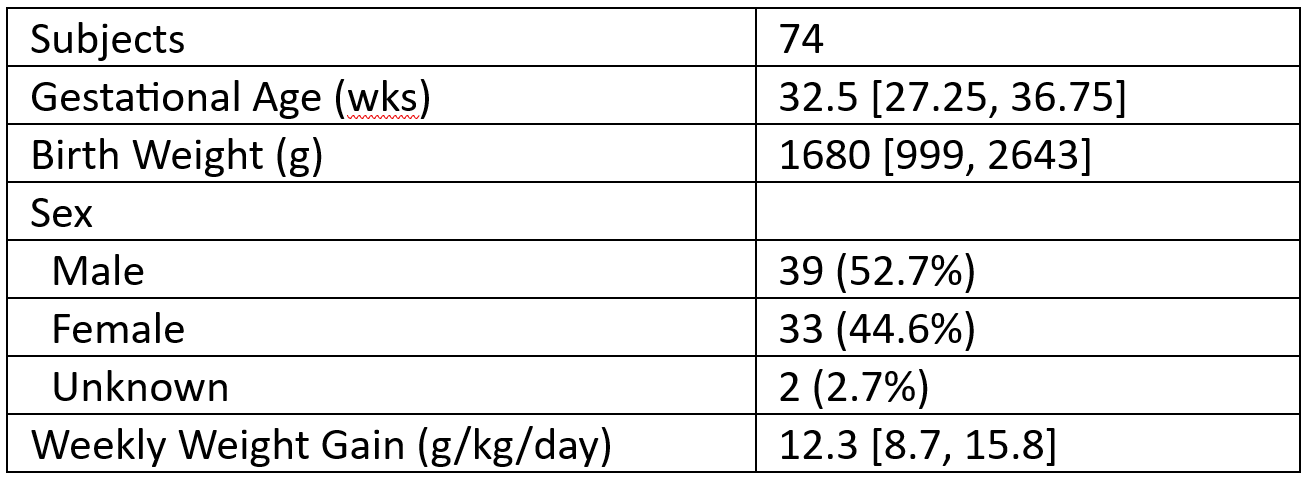 Patient demographics. Data are expressed as Median [IQR] or Count (Percent).
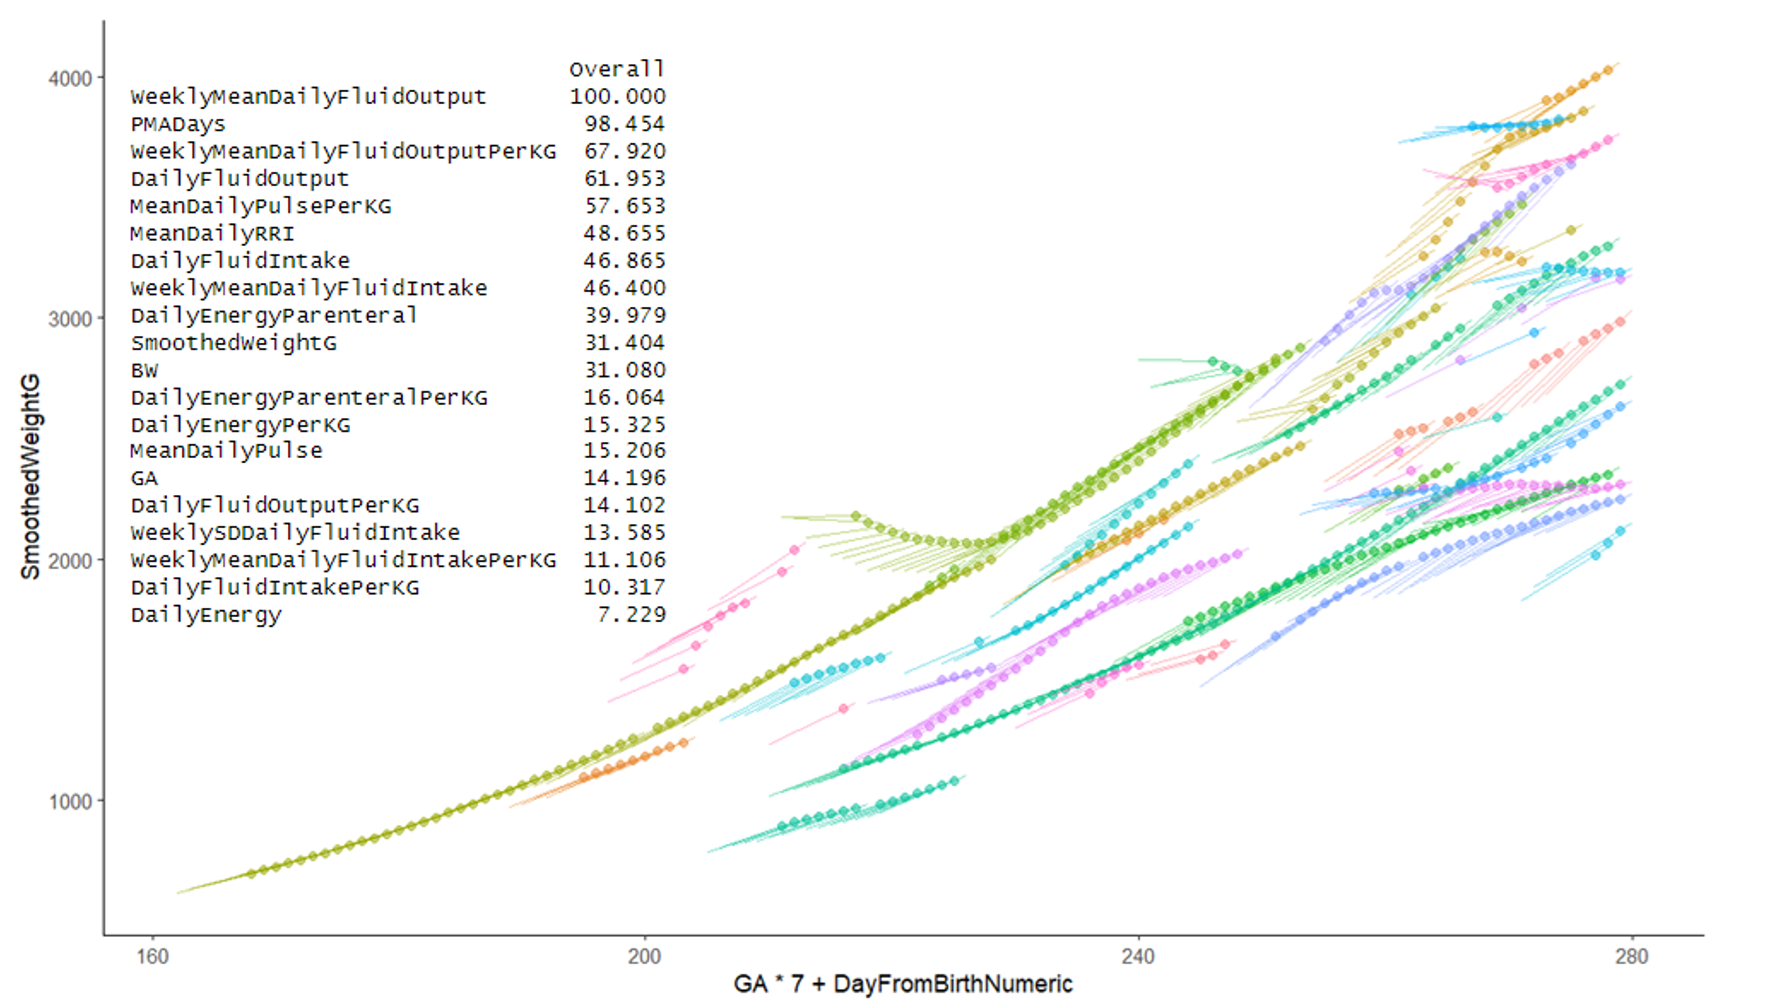 Growth plot of patients in the test set. The dots represent smoothed weight (in grams), while the lines the beginning and end, respectively, of a 7-day weight gain prediction. The x-axis the post menstrual age. Importance of the top 20 explanatory variables is also included.
.png) Model Performance. Panel A (left): scatterplot of achieved versus modeled weekly weight gain. Dashed lines indicate the growth failure threshold for modeled (vertical line) and achieved (horizontal line). Panel B (right): ROC curve for sensitivity versus specificity for growth failure (achieved growth <8 g/kg/day) versus modeled weekly weight gain.
Model Performance. Panel A (left): scatterplot of achieved versus modeled weekly weight gain. Dashed lines indicate the growth failure threshold for modeled (vertical line) and achieved (horizontal line). Panel B (right): ROC curve for sensitivity versus specificity for growth failure (achieved growth <8 g/kg/day) versus modeled weekly weight gain.