
Neonatal Fetal Nutrition & Metabolism
Session: Neonatal Fetal Nutrition & Metabolism 1
 photo")
Timothy J. Boly, DO (he/him/his)
Instructor of Pediatrics
University of Iowa Stead Family Children's Hospital
Iowa City, Iowa, United States
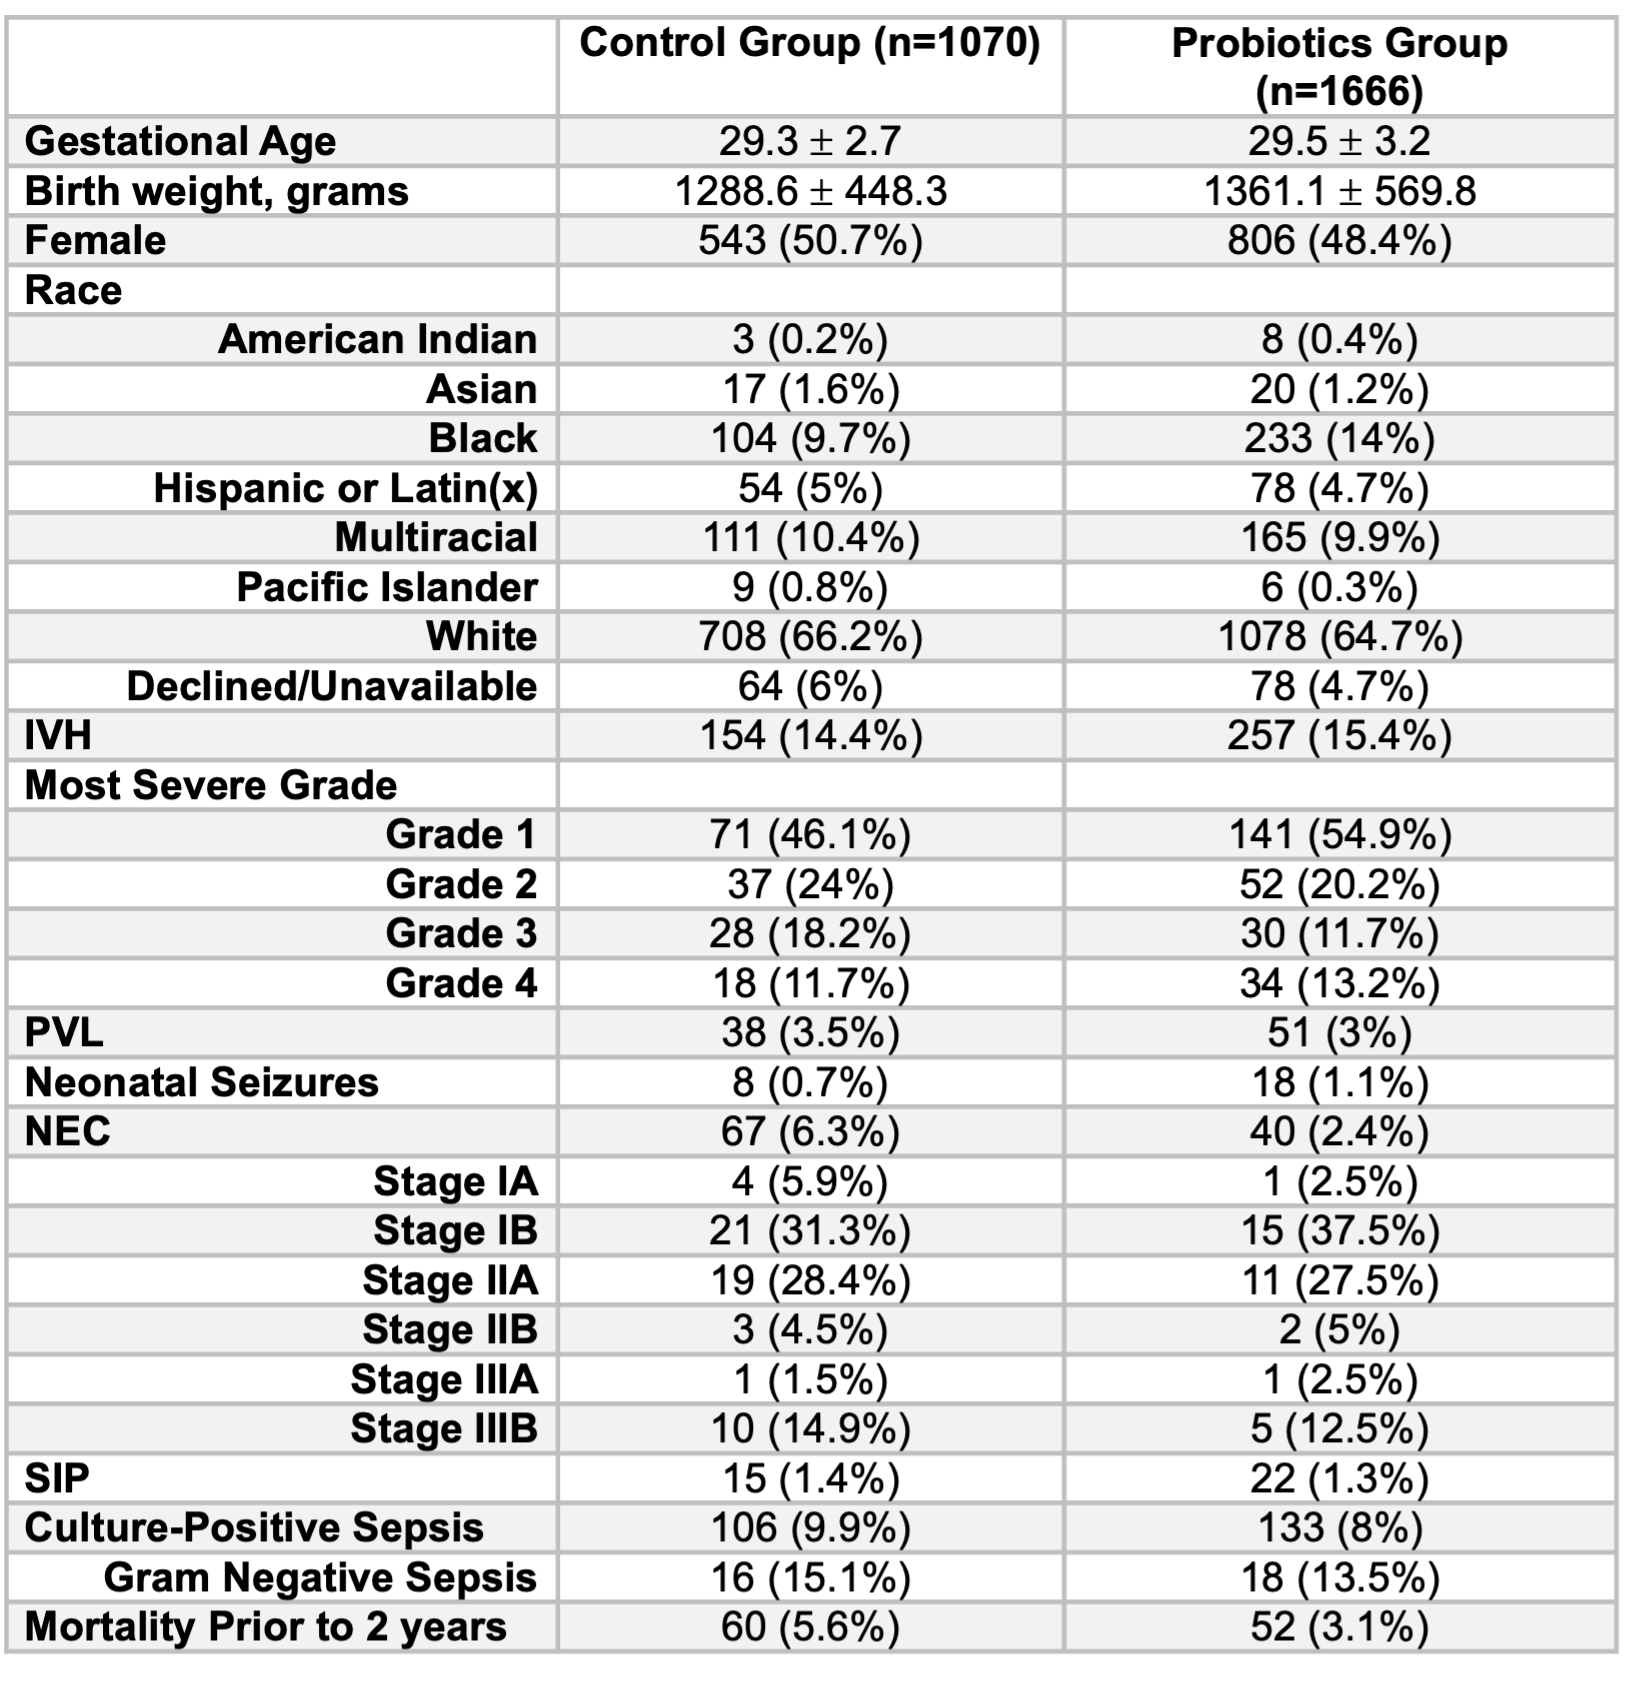 Demographics data of included infants in the control and probiotics group. Data is presented as mean +/- standard deviation or n (%). IVH: intraventricular hemorrhage; PVL: periventricular leukomalacia; NEC: necrotizing enterocolitis; SIP: spontaneous intestinal perforation
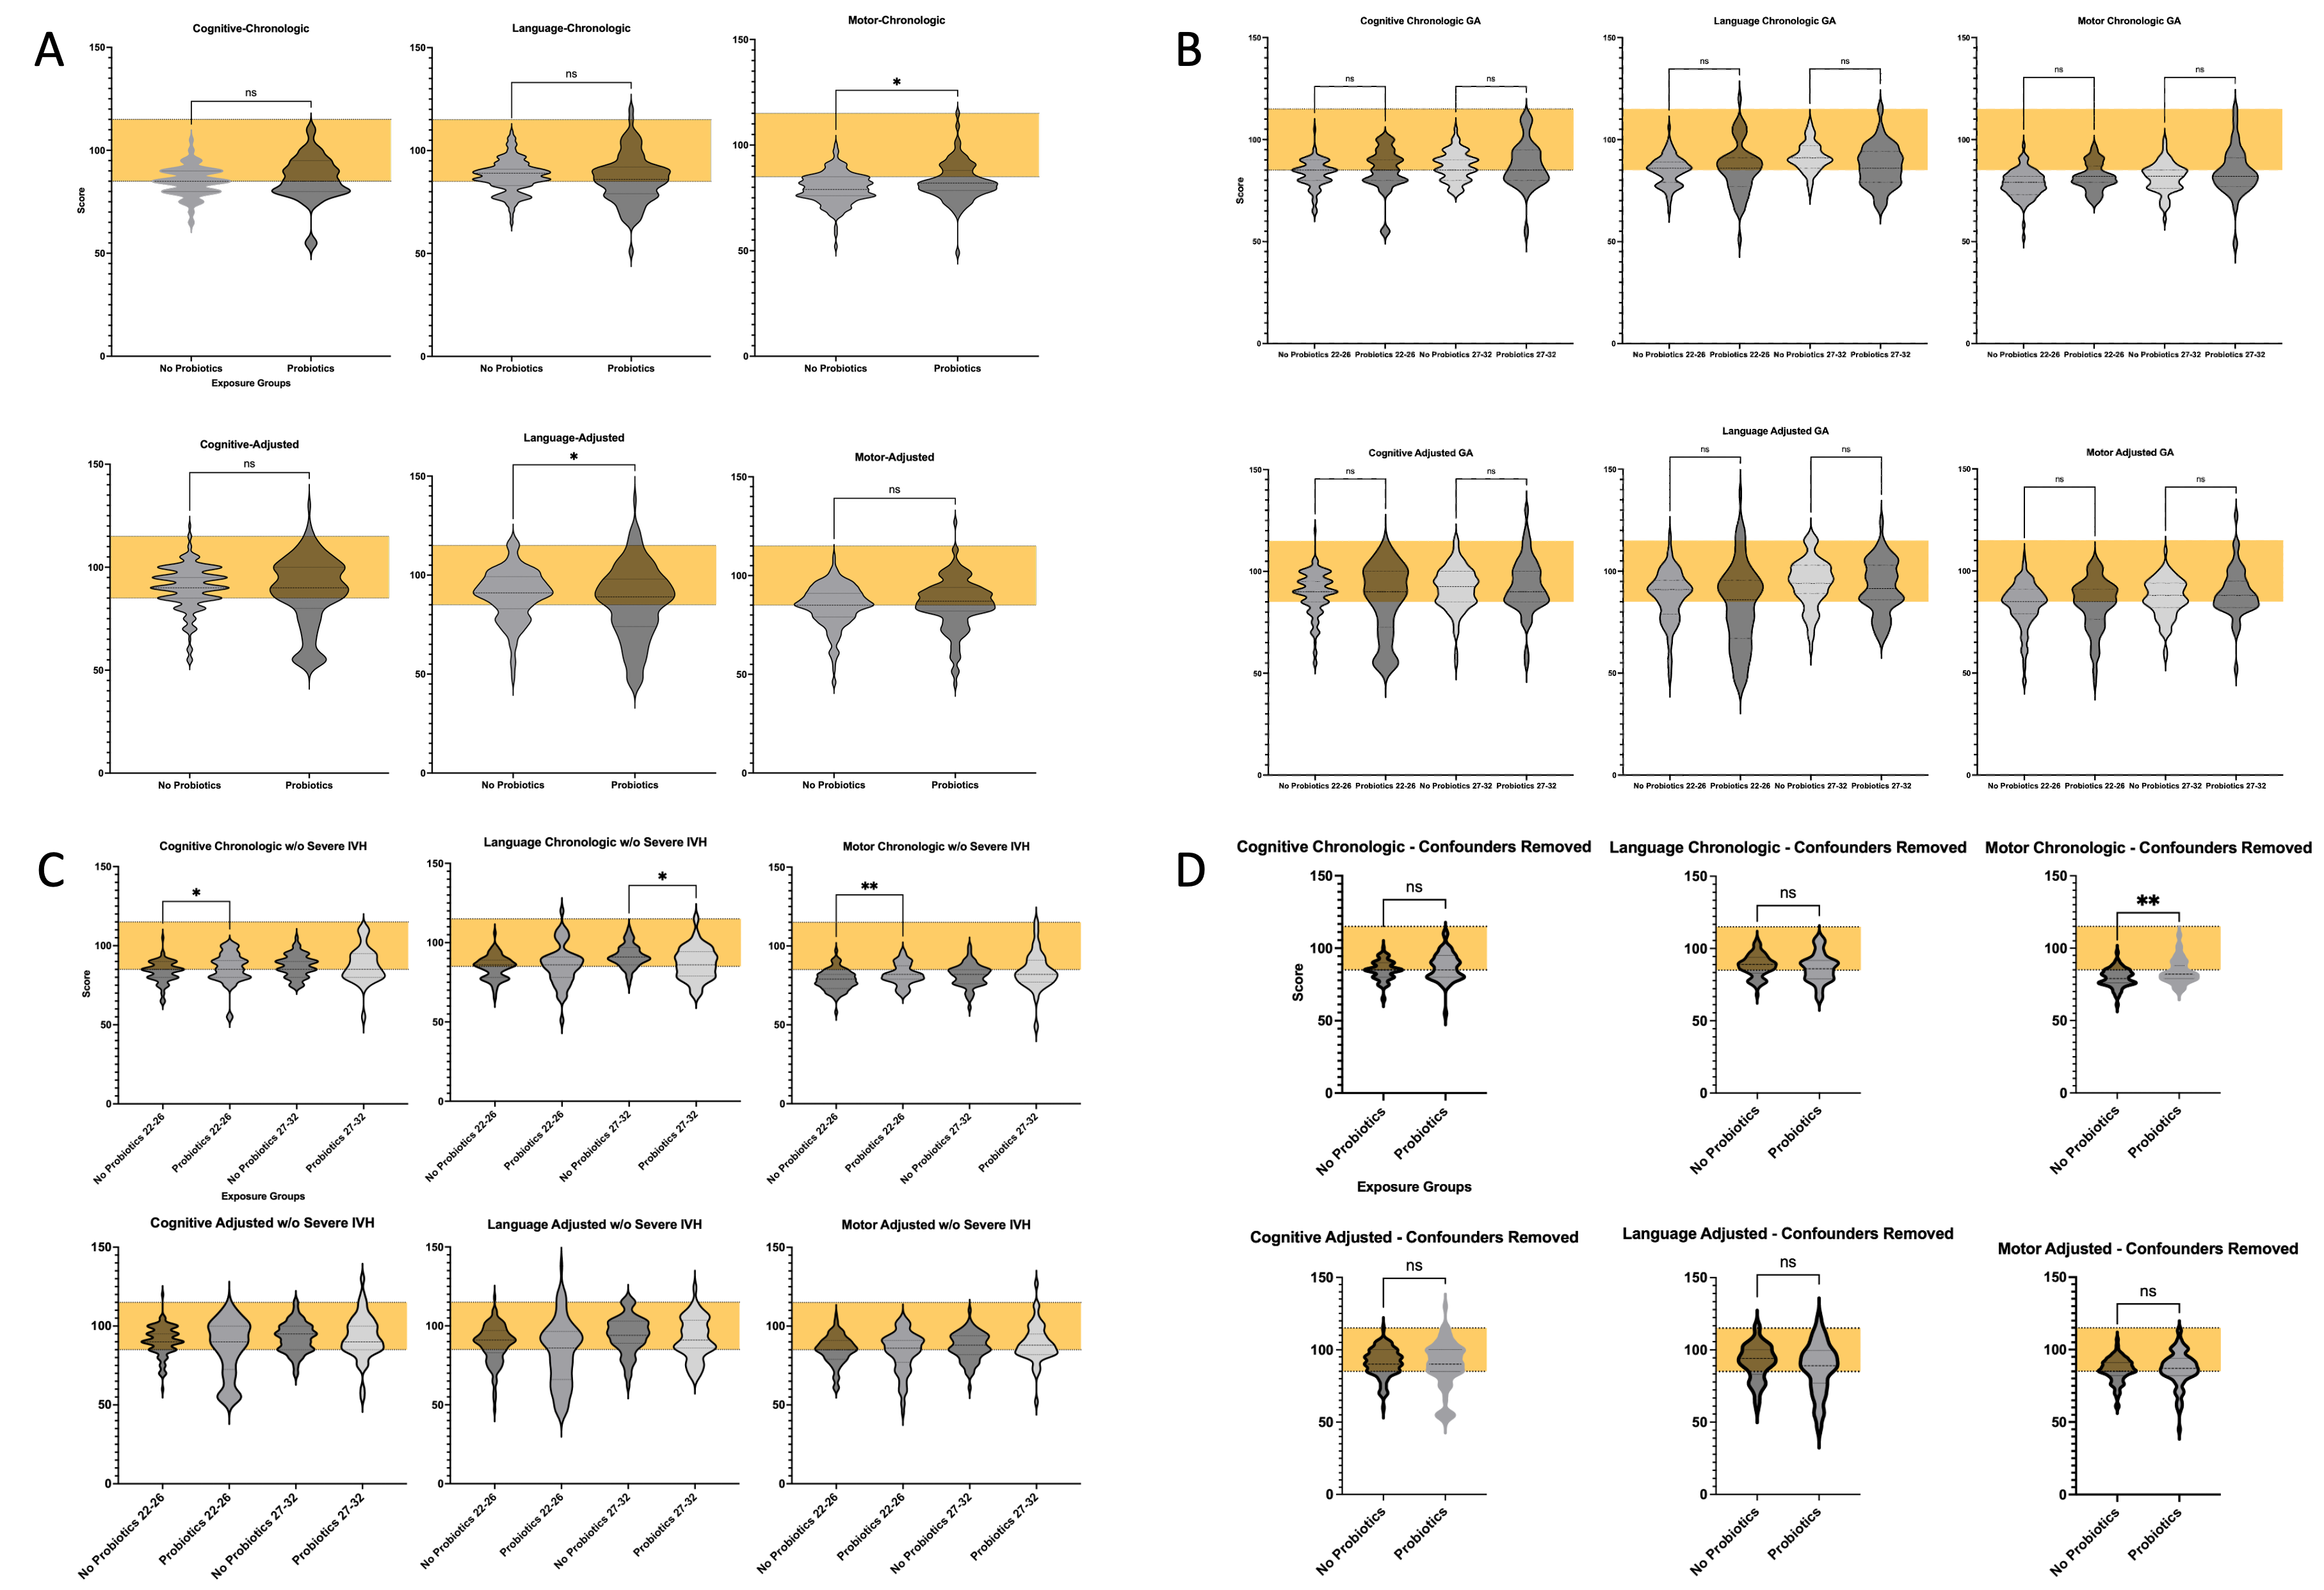 (A) Subcomponent scores by chronologic and adjusted ages when stratified exposure group (No Probiotics vs Probiotics). Shaded area demonstrates distribution of mean score±1SD. (B) Subcomponent scores by chronologic and adjusted ages when stratified by gestational age (22-26 weeks' vs 27-32 weeks') and probiotic exposure. Shaded area demonstrates distribution of mean score±1SD. (C) Subcomponent scores by chronologic and adjusted ages stratified by GA when severe IVH (grades III and IV) removed. (D) Subcomponent scores by chronologic and adjusted ages when possible confounders (severe IVH, culture-positive sepsis, SIP, NEC, and congenital anomalies) removed.
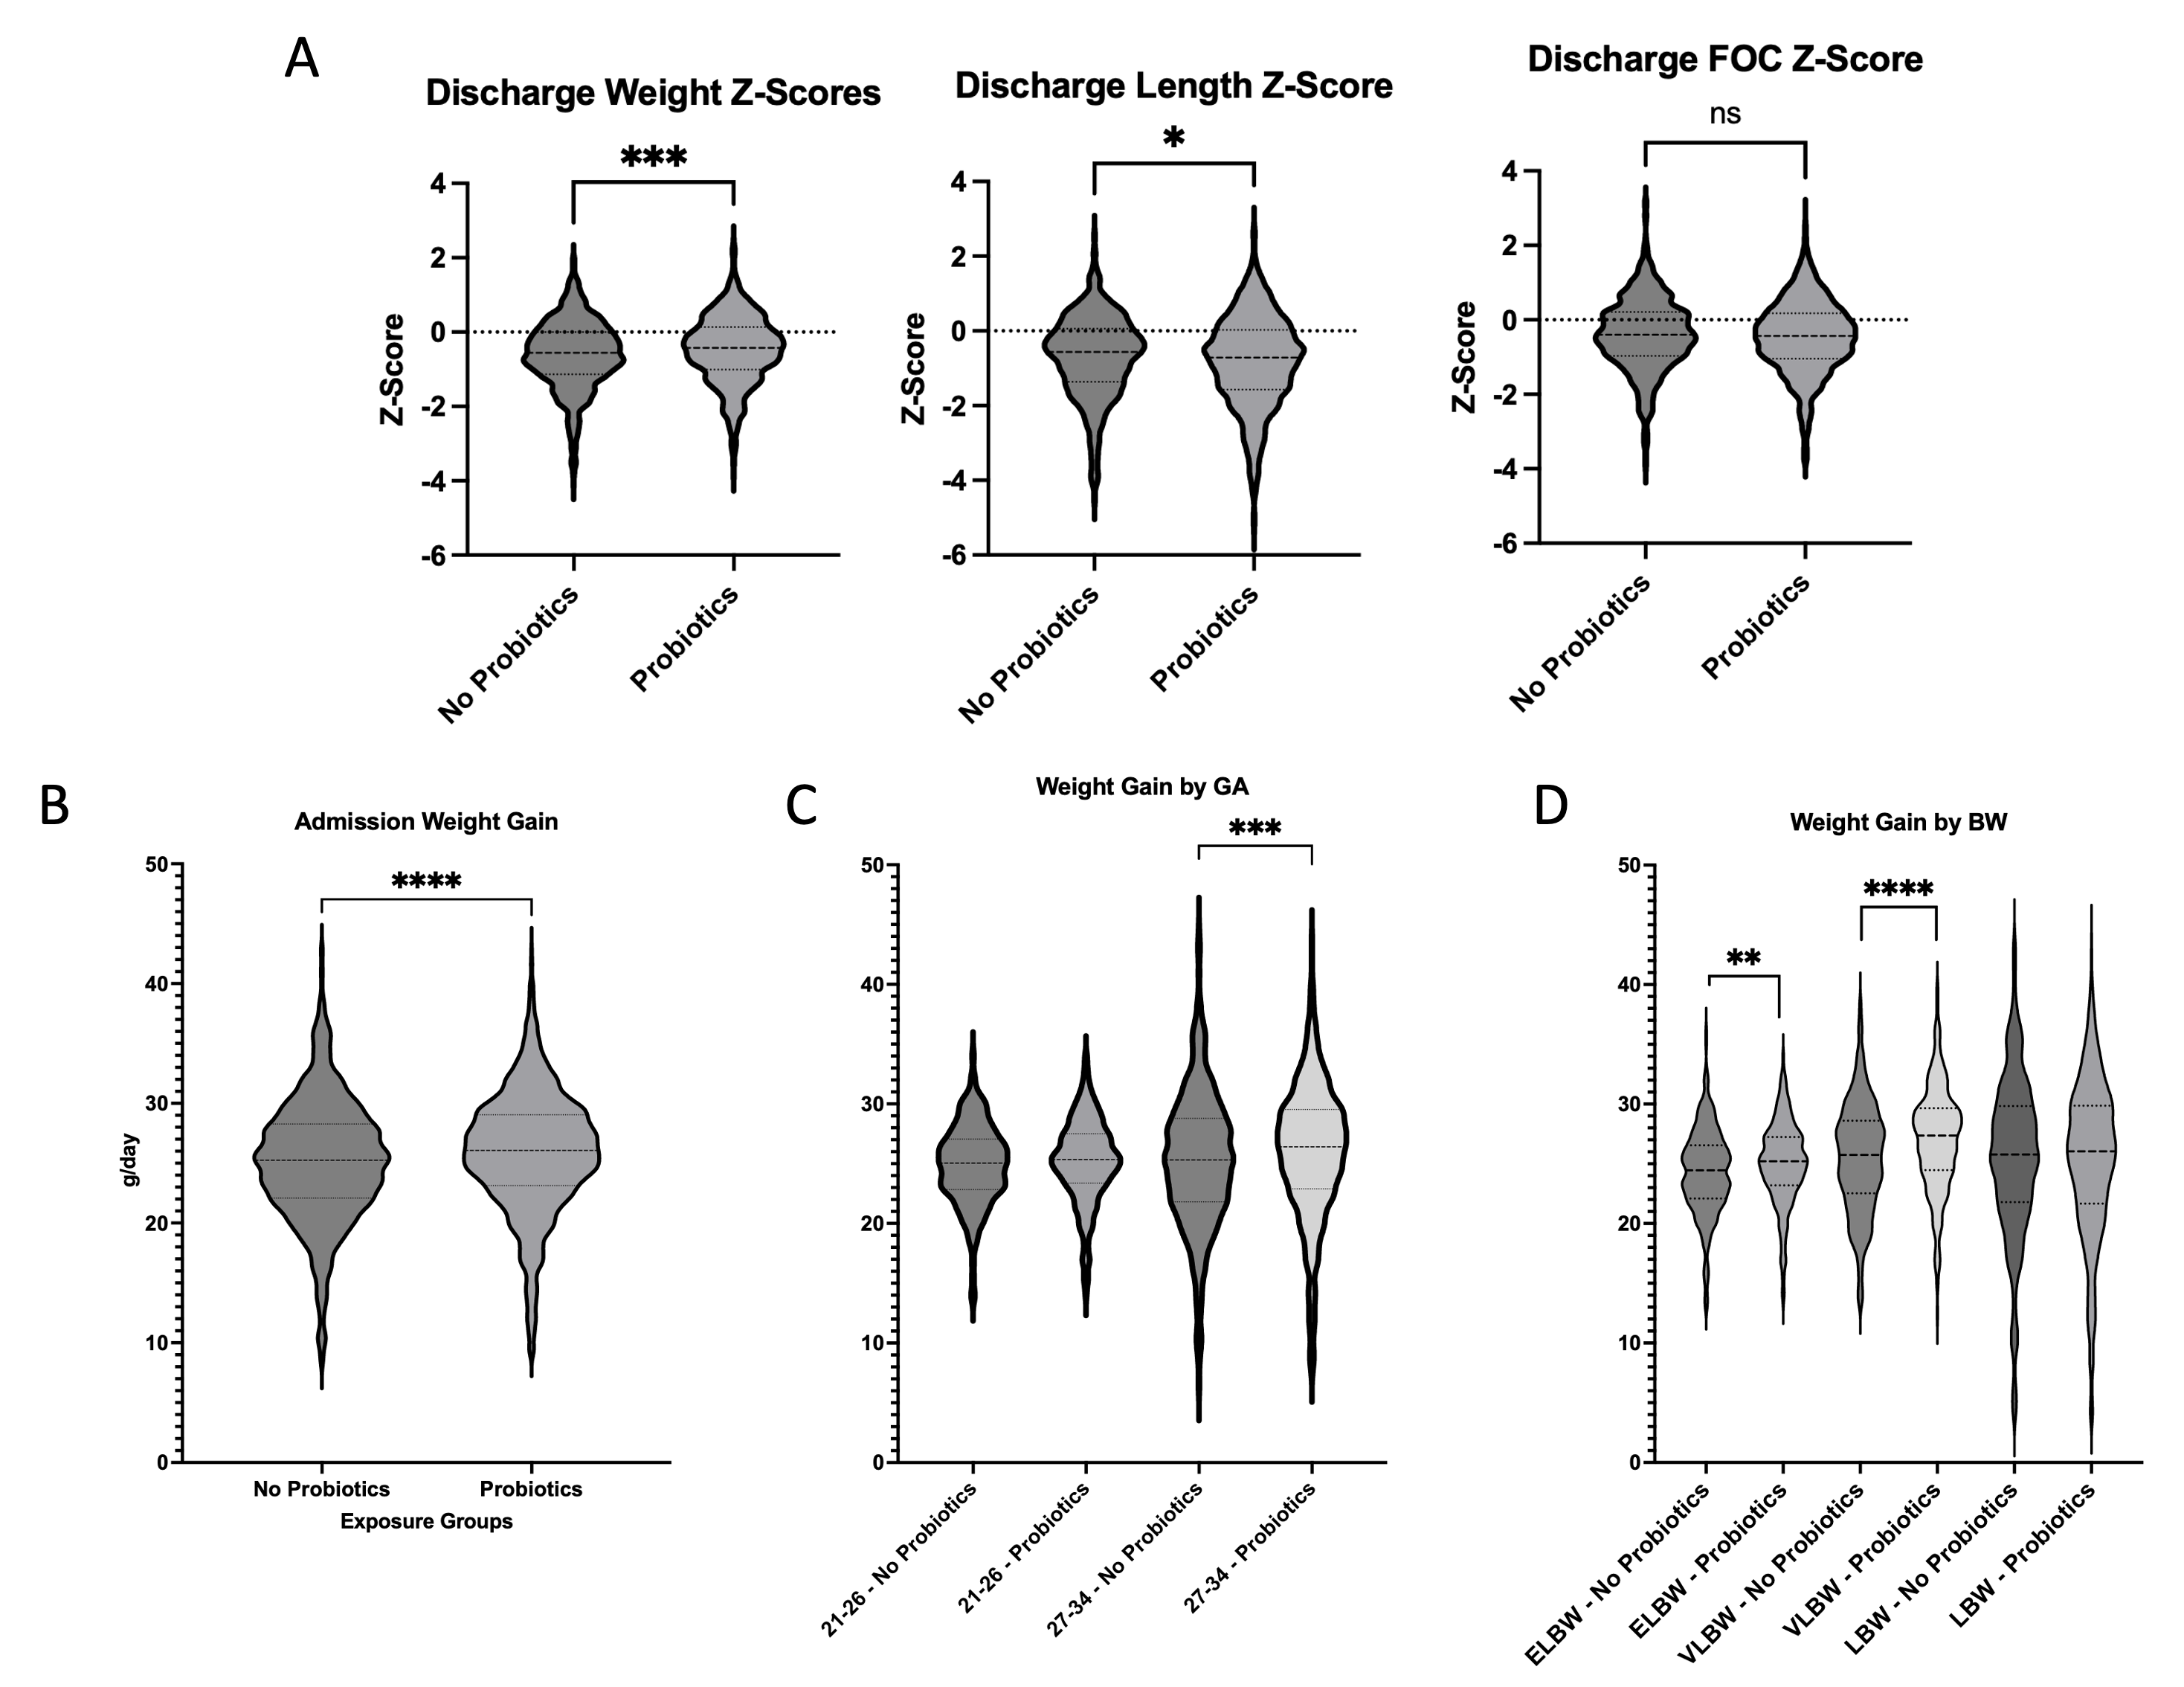 (A) Discharge weight, length, and fronto-occipital circumference (FOC) Z-score by exposure group. (B) Admission weight gain in grams/day by exposure group. (C) Admission weight gain in grams/day by exposure group and gestational age category. (D) Admission weight gain in grams/day by exposure group and birth weight category.