282 - Walking Towards Equity: Enhancing Pediatric Pedestrian Safety Through Data Driven Solutions
Saturday, April 25, 2026
3:30pm - 5:45pm ET
Publication Number: 2272.282
Brittany N. Fitzpatrick, Children's National Hospital, Arlington, VA, United States; Sadiqa Kendi, Children's National Health System, Washington, DC, United States; Fatemeh Naghiloo, Safe kids Worldwide, Silver Spring, MD, United States
Pediatric Emergency Medicine Fellow Children's National Hospital Arlington, Virginia, United States
Background: Rates of pediatric pedestrian fatalities have increased over the past 10 years, especially amongst adolescents. There continue to be racial disparities, with Black males disproportionately impacted.
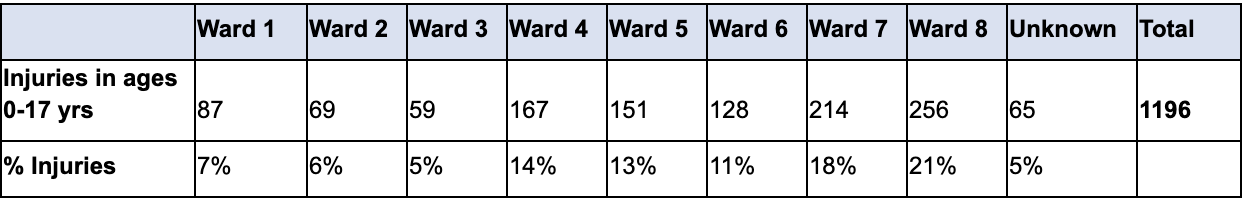
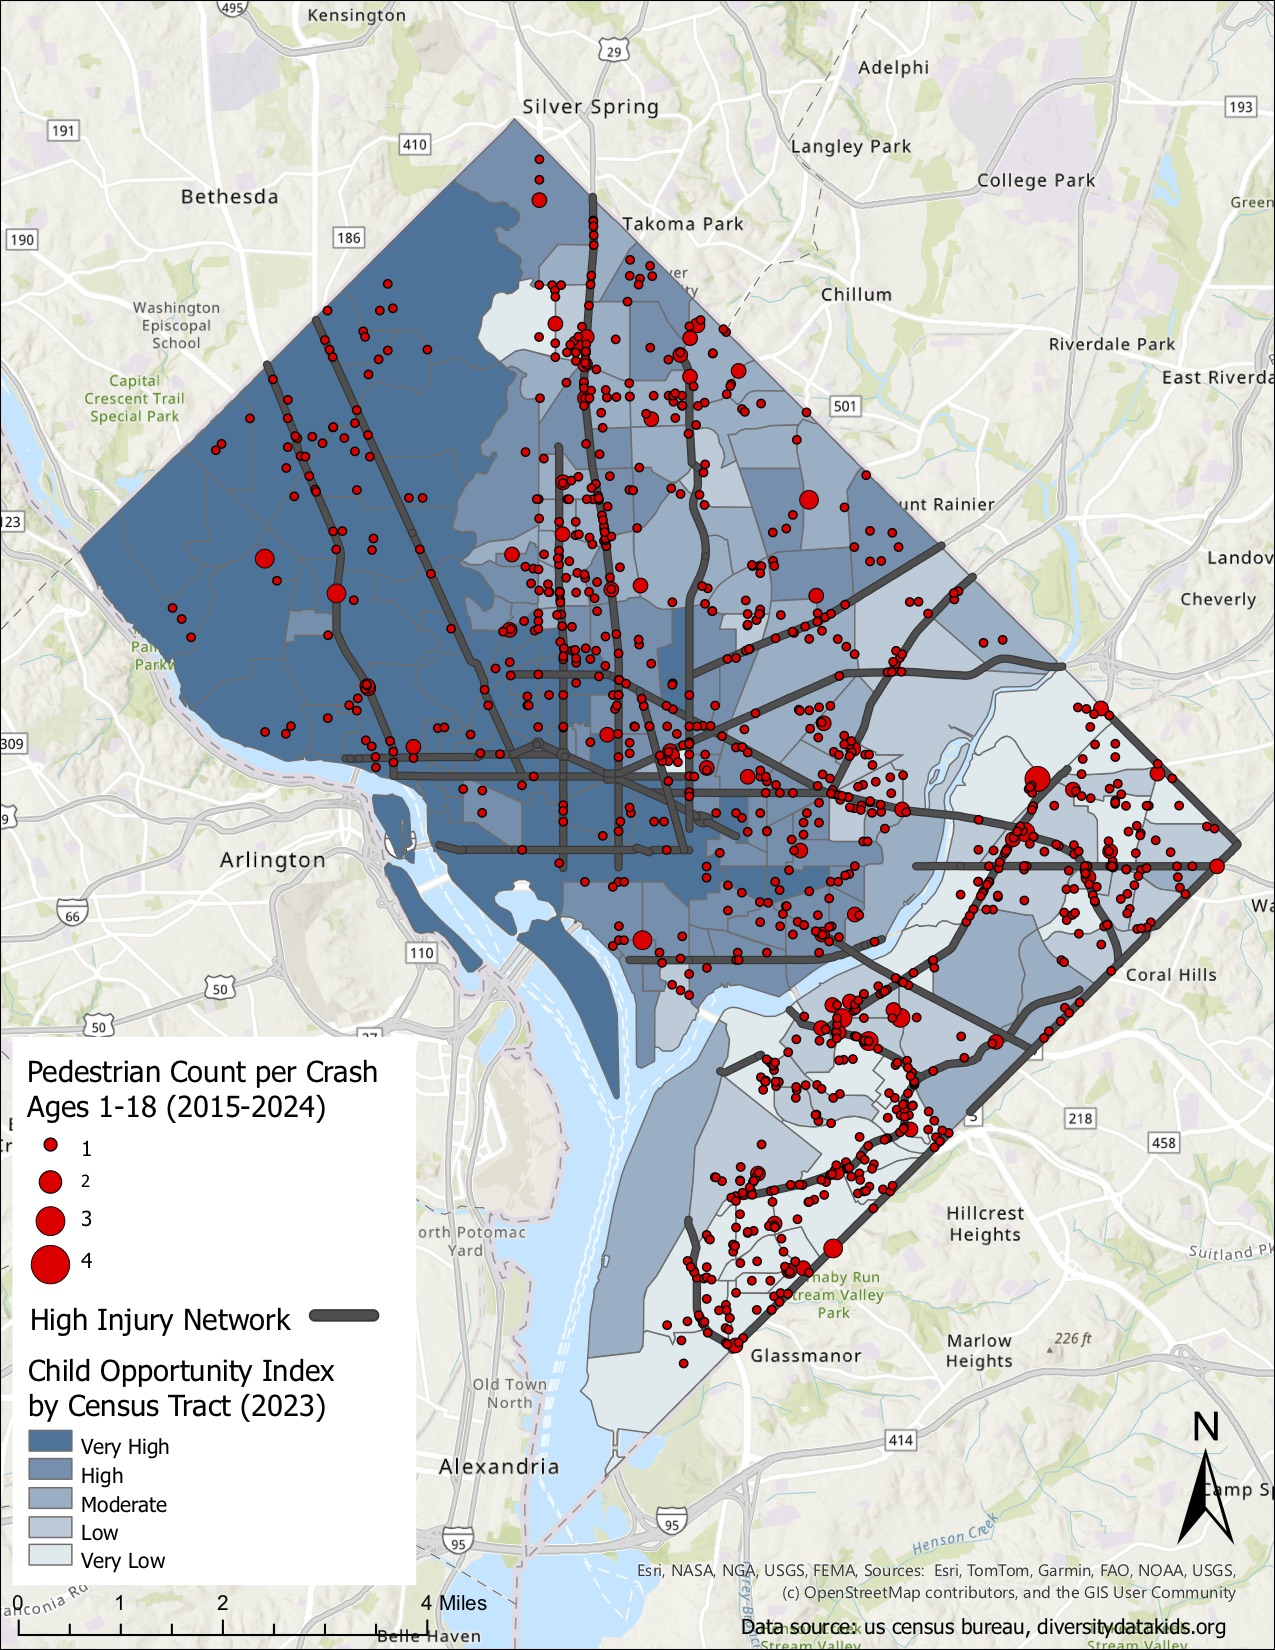
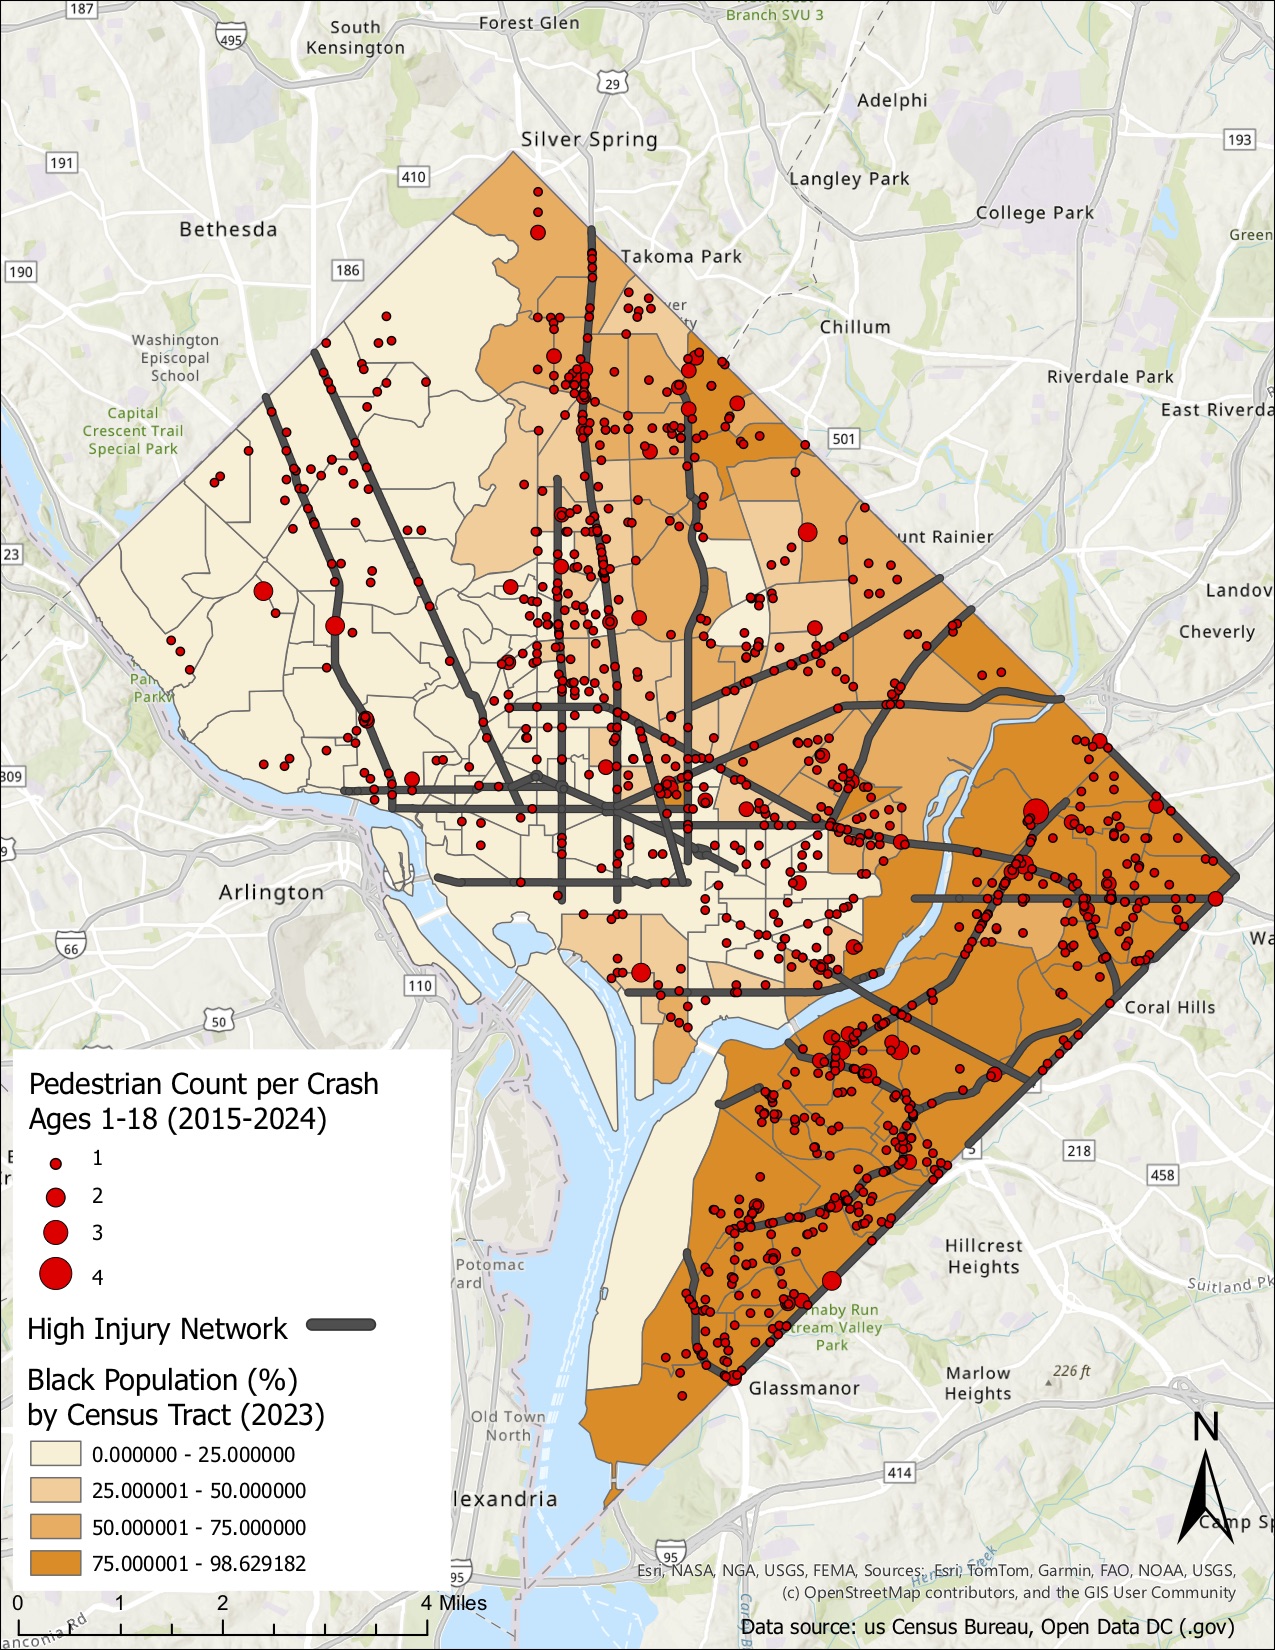
Washington, DC is a metropolitan area that relies heavily on public transportation and walking as primary modes of travel, increasing the overall risk of injury. Corridors with large arterial roads and the highest rates of serious injuries and fatalities are known as the High-Injury Network, however this is driven by adult data. Objective: Given the unique experiences of youth as vulnerable road users, including travel within school zones and to daily activities, our objective is to understand the distribution of pediatric pedestrians injured, determine whether pediatric pedestrian injuries cluster along the High-Injury Network, and identify areas at high-risk for pediatric pedestrian injuries in Washington, DC. Design/Methods: This is a retrospective study describing pediatric pedestrian injuries over a 10 year period (2014-2024) in children ages 1 to 17 years old in Washington, DC based on DC Highway Safety Office data. Summary statistics were calculated to identify demographic distribution of injuries. The location of injuries was visualized using Geographic Information Systems (GIS) mapping and stratified by variables such as Childhood Opportunity Index (COI), Black population and Ward. Results: The total number of pediatric pedestrian injuries from 2014-2024 was 1,196. Of the total, 121 (10%) were considered major injuries and there were 6 fatalities. Table 1 shows the distribution of injuries by ward, with the highest numbers in Wards 7 and 8. The proportion of injuries were higher in children ages 10-17 years (59.4%) in comparison to younger children. Figures 1 and 2 show pediatric pedestrian injuries occur with substantial frequency along the High-Injury Network and in Wards with a higher Black population.
Conclusion(s): There are clusters of pediatric pedestrian injury along the High-Injury Network. Notably, the largest proportion of pediatric pedestrian injuries occur in Wards 7 and 8 where the Black population is the densest and there is a higher concentration of moderate to very low COI. Results are likely multifactorial but may include risk within the built environment such as location of arterial roads, historical redlining and segregation, and increased exposure as a pedestrian.
Table 1: Pediatric pedestrian injuries from 2014-2024 in Washington, DC stratified by Ward
Figure 1: Pediatric pedestrian injuries from 2014-2024 cluster along the High-Injury Network and in areas with lower Childhood Opportunity Index
Figure 2: Pediatric pedestrian injuries from 2014-2024 cluster along the High-Injury Network and in areas with higher Black population

 photo")