
Hospital Medicine
Session: Hospital Medicine 3
 Credit")
 photo")
Shray Kumar, BS (he/him/his)
Medical Student Research Fellow
Akron Children's Hospital
Akron, Ohio, United States
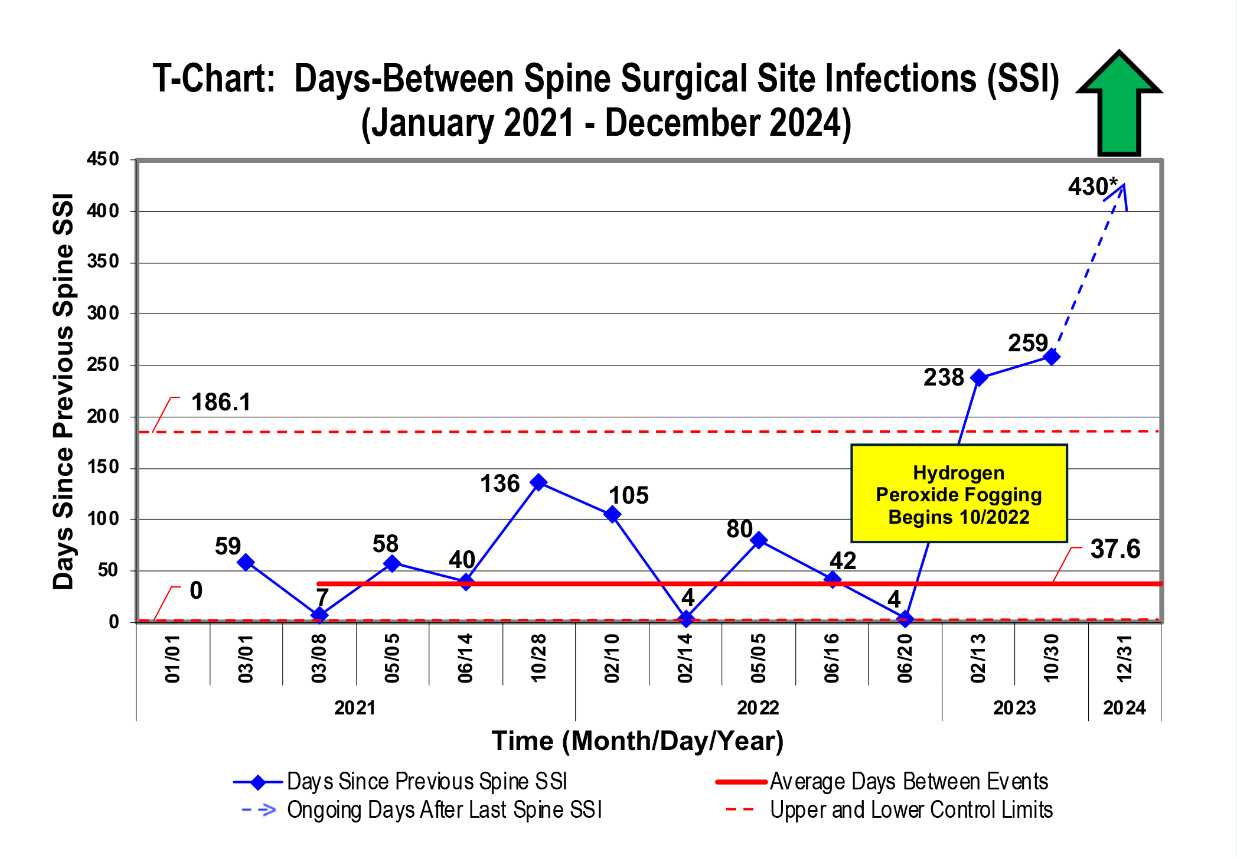 Time-between-events T-chart demonstrating both the date of each SSI occurrence with the associated time since the previous SSI occurrence and the average time-between events. The solid blue line with diamond data points indicates the days since previous deep spine SSI. The dotted blue line with an arrow indicates the ongoing days from the last spine SSI to the end of the study period, indicated by an asterisk to show that there was not an SSI on December 31, 2024. The solid red line indicates the average time in days-between events. The dotted red lines indicate the control limits. Abbreviations found in figure and title: SSI = surgical site infection.