
Neonatal Neurology
Session: Neonatal Neurology 5: Preterm & Neurodevelopment
 photo")
Flora Wong, MBBS, PhD (she/her/hers)
Consultant neonatologist
Monash Children's Hospital
Clayton, Victoria, Australia
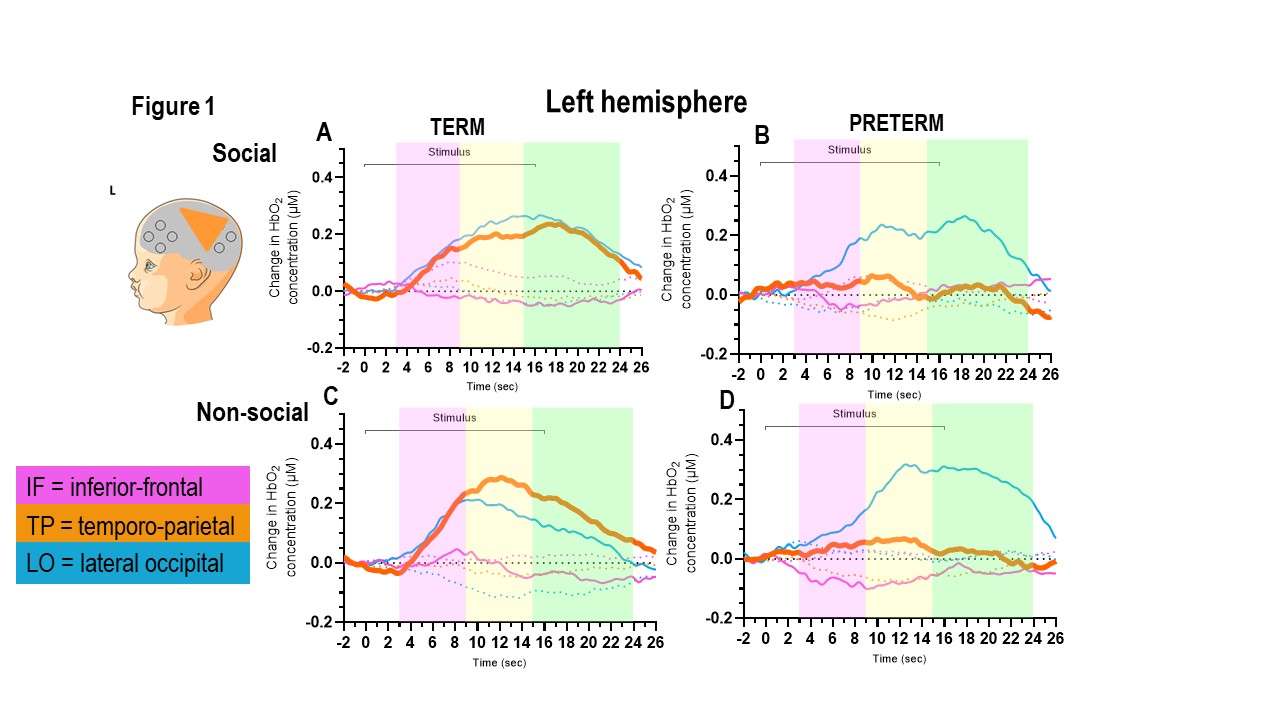 Examples of ΔHbO2 (solid lines) and ΔHbR (dashed lines) following social (A&B) and non-social (C&D) stimuli, averaged in term (A&C) and preterm (B&D) infants, are shown for the left hemisphere. The coloured lines represent the 3 brain region of interests (pink - IF, orange - TP, blue- LO). Note the marked difference between term and preterm infants in the TP region (orange line). The colour-shaded areas indicate the 3 time windows post-stimulus onset for data analyses (pink 3-8 sec, yellow 9-14 sec, green 15-23 sec).
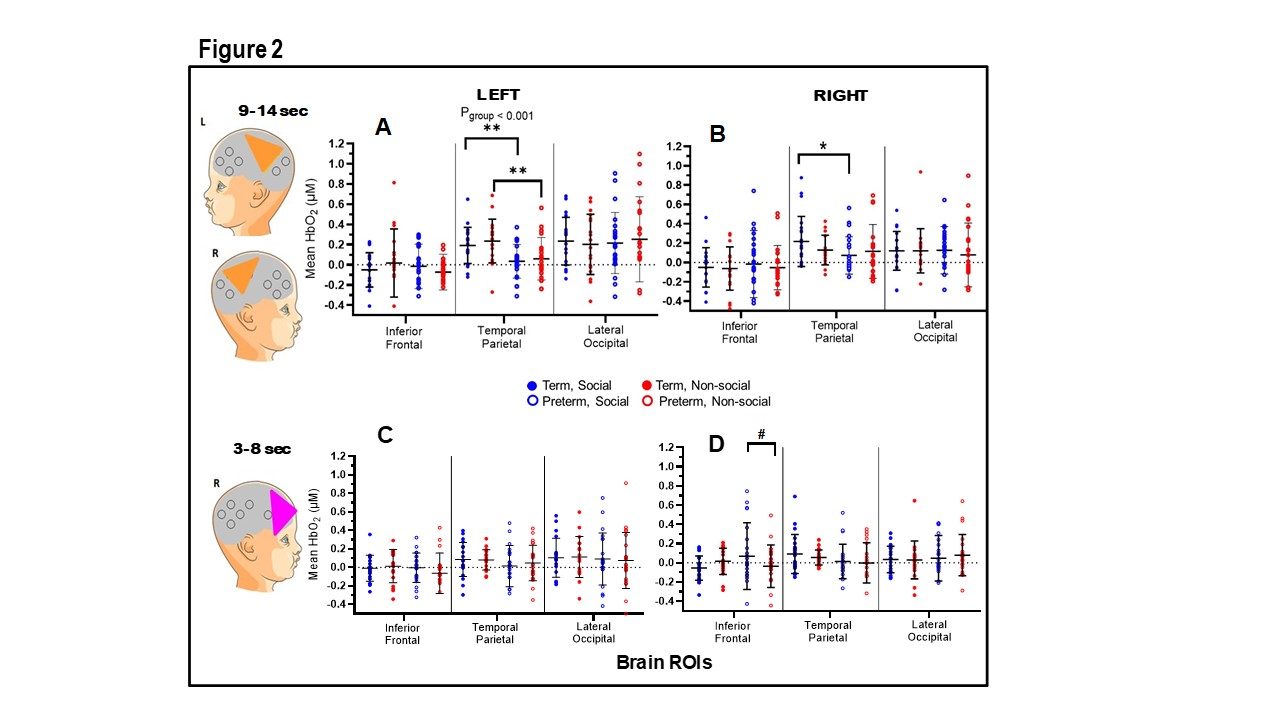 Circles (closed, term infants; open, preterm infants; blue, social; red, non-social) show individual values and bars represent mean±SD.