
Neonatal General
Session: Neonatal General 6: ID/Immunology/Renal/Genetics
 photo")
Chelsea K. Bitler, DO, MS (she/her/hers)
Neonatal-Perinatal Medicine & Clinical Informatics Fellow
UPMC Children's Hospital of Pittsburgh
Pittsburgh, Pennsylvania, United States
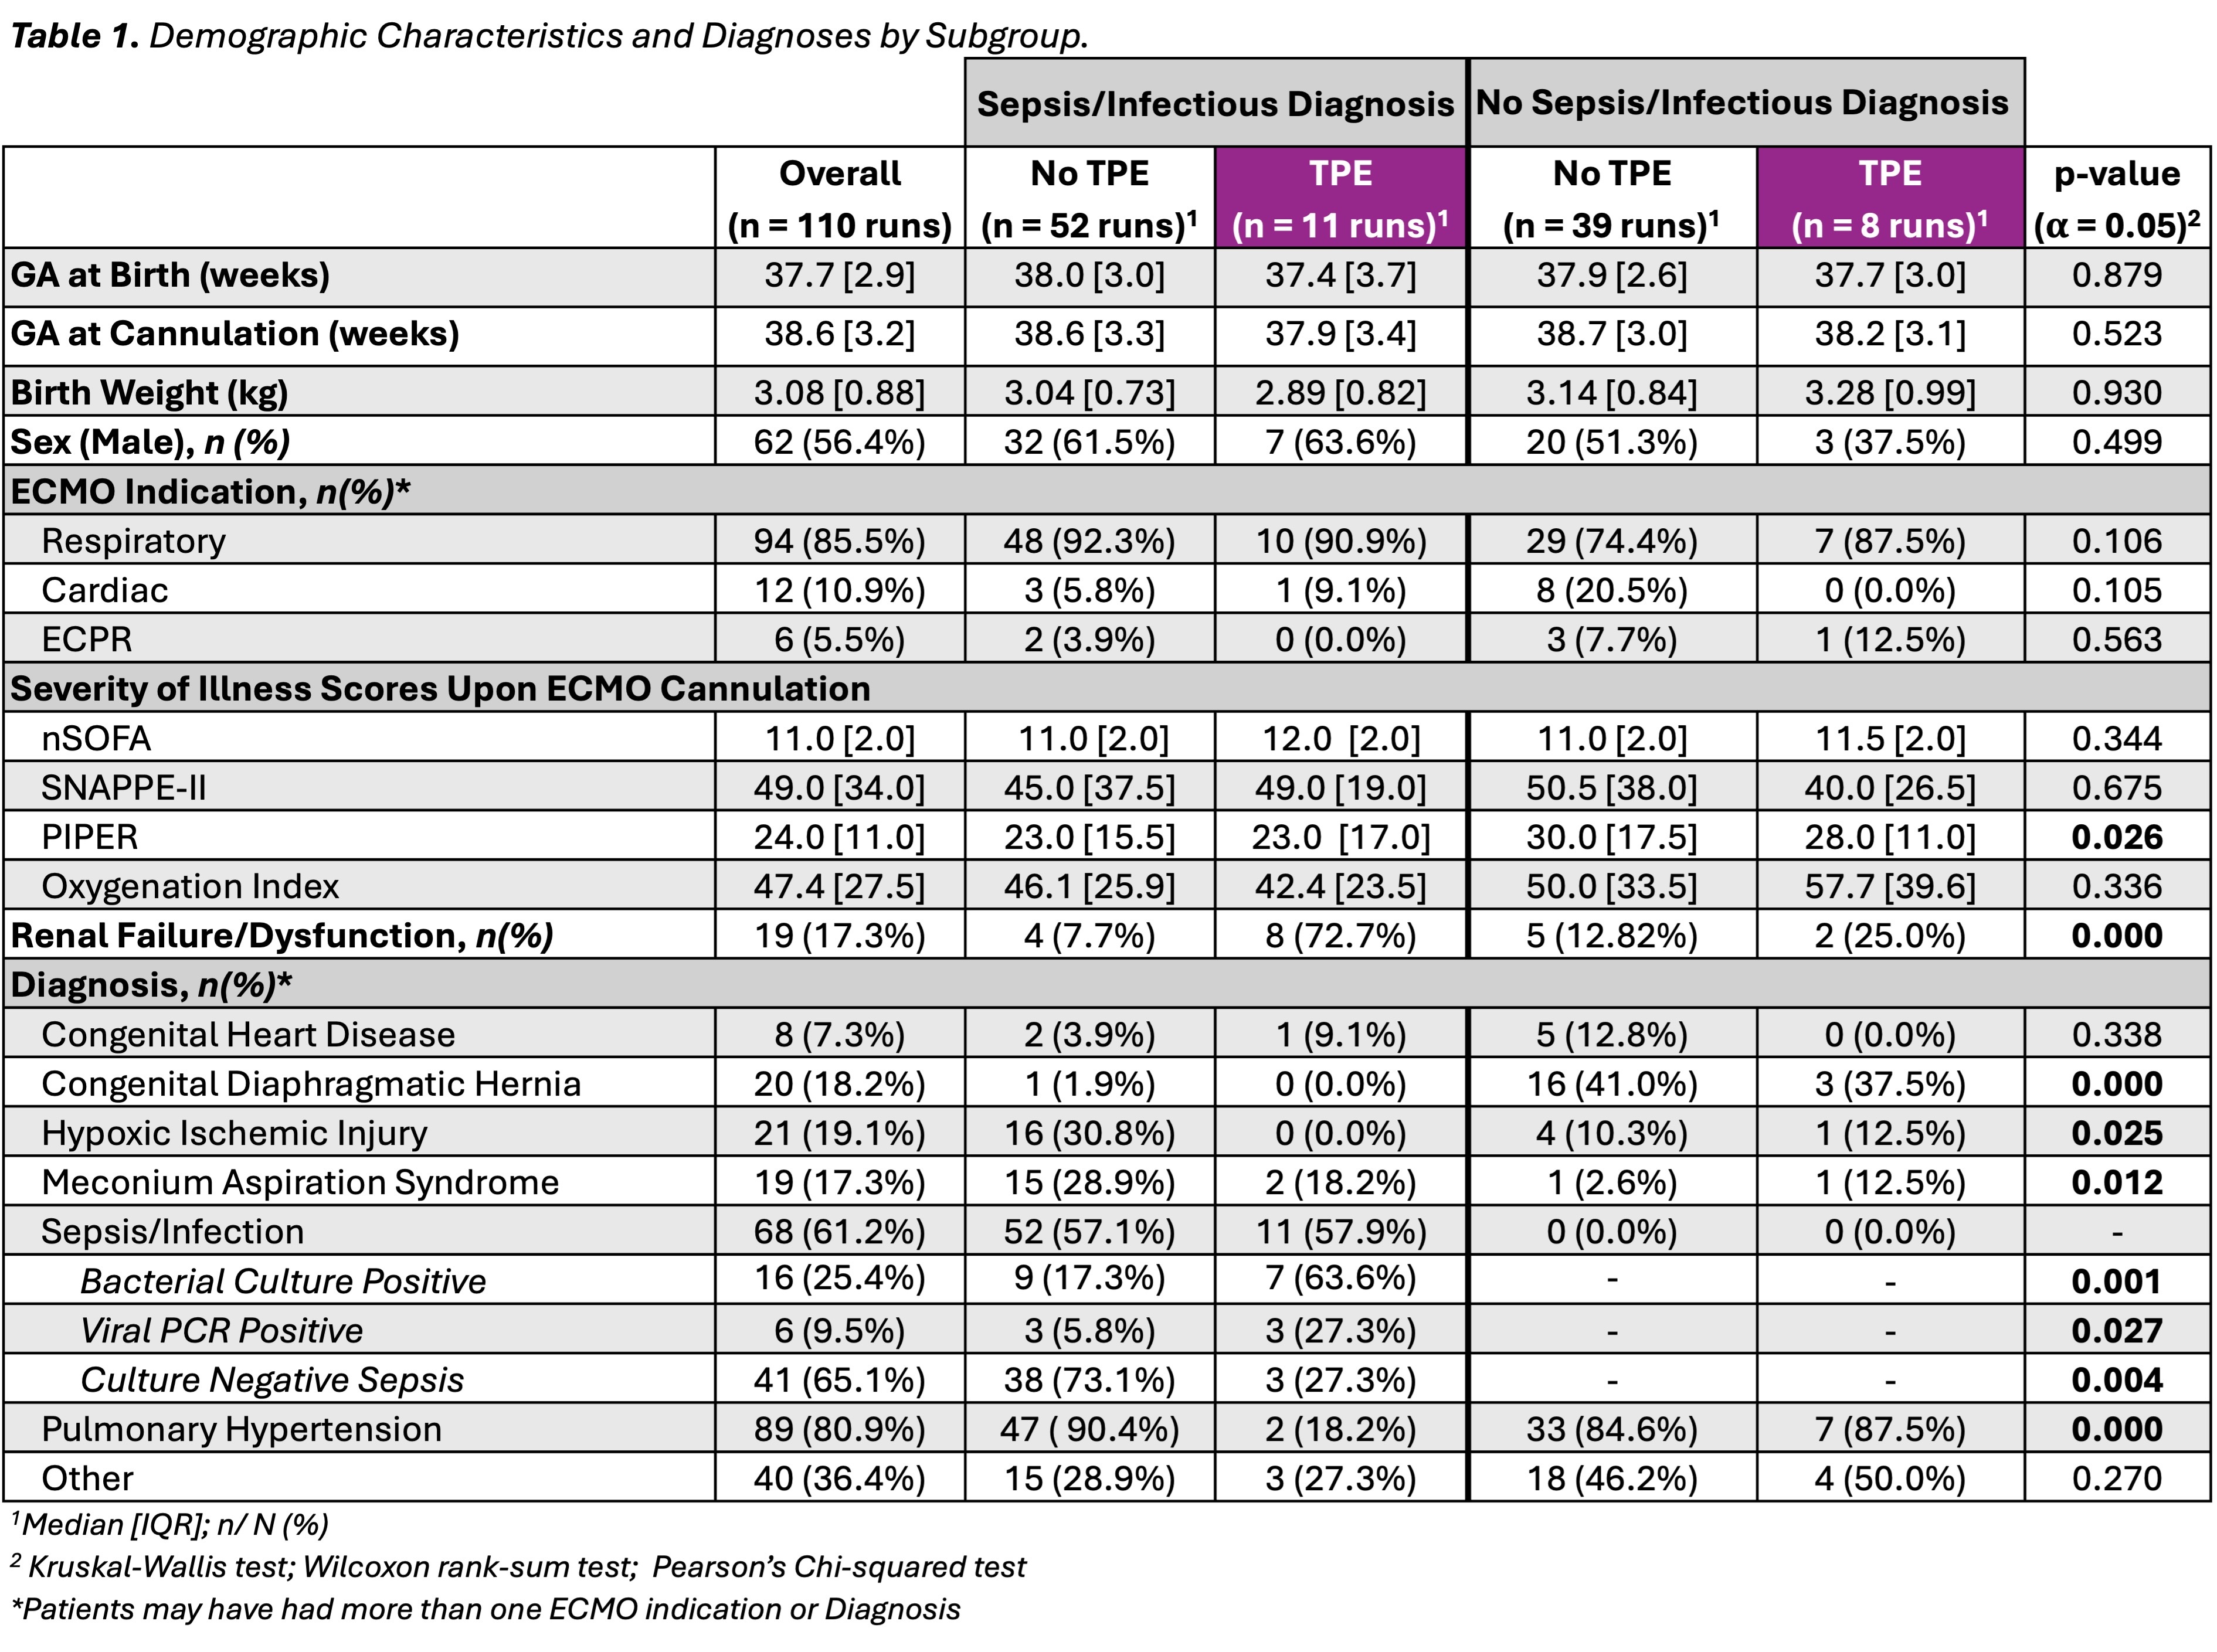 Demographic characteristics and diagnoses by subgroup.
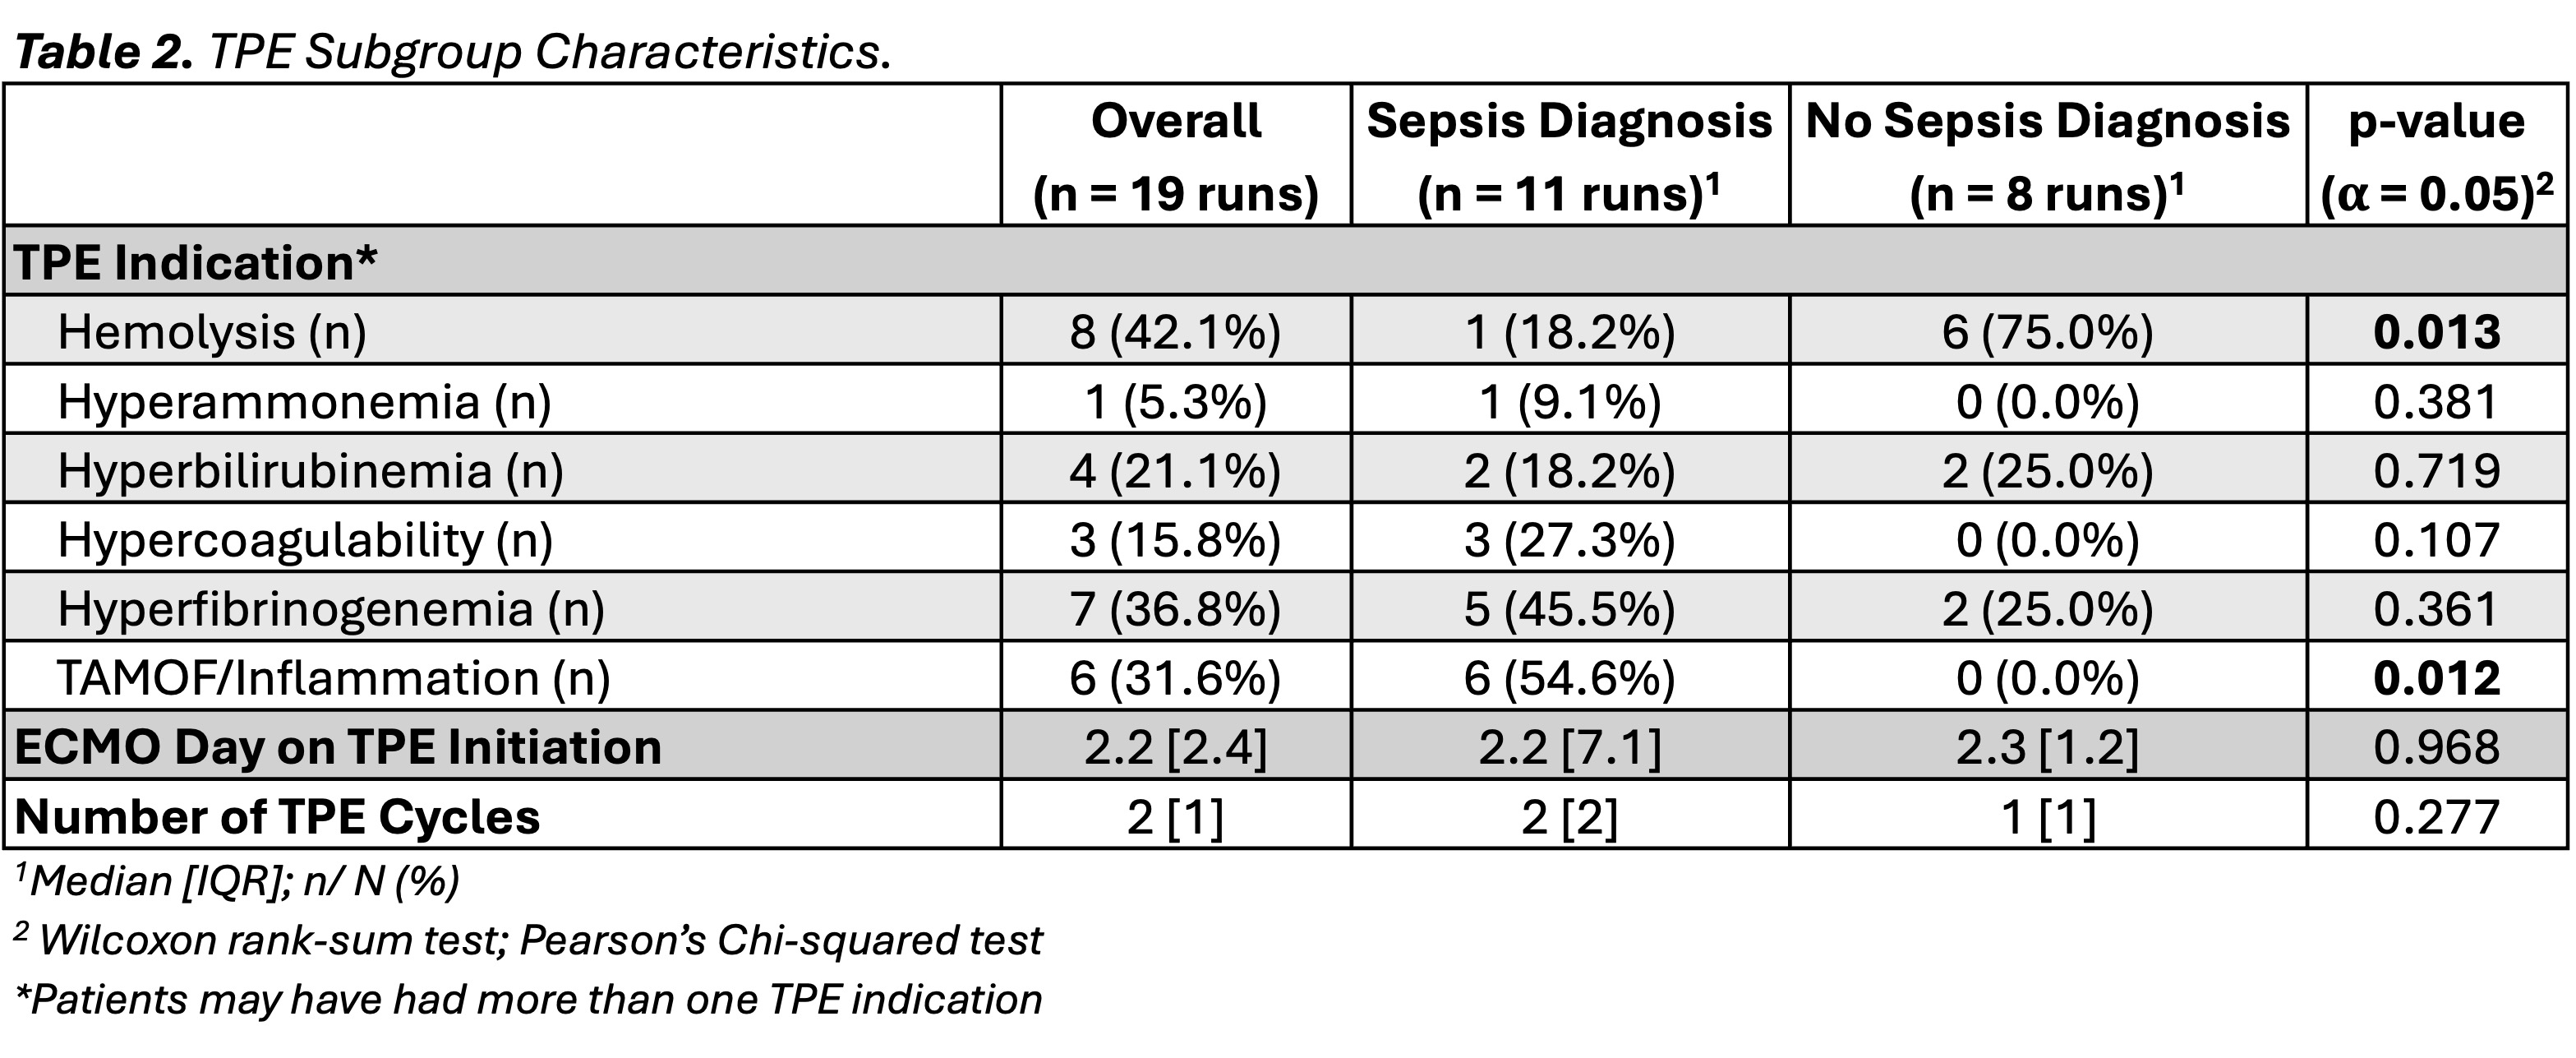 TPE indications by subgroup.
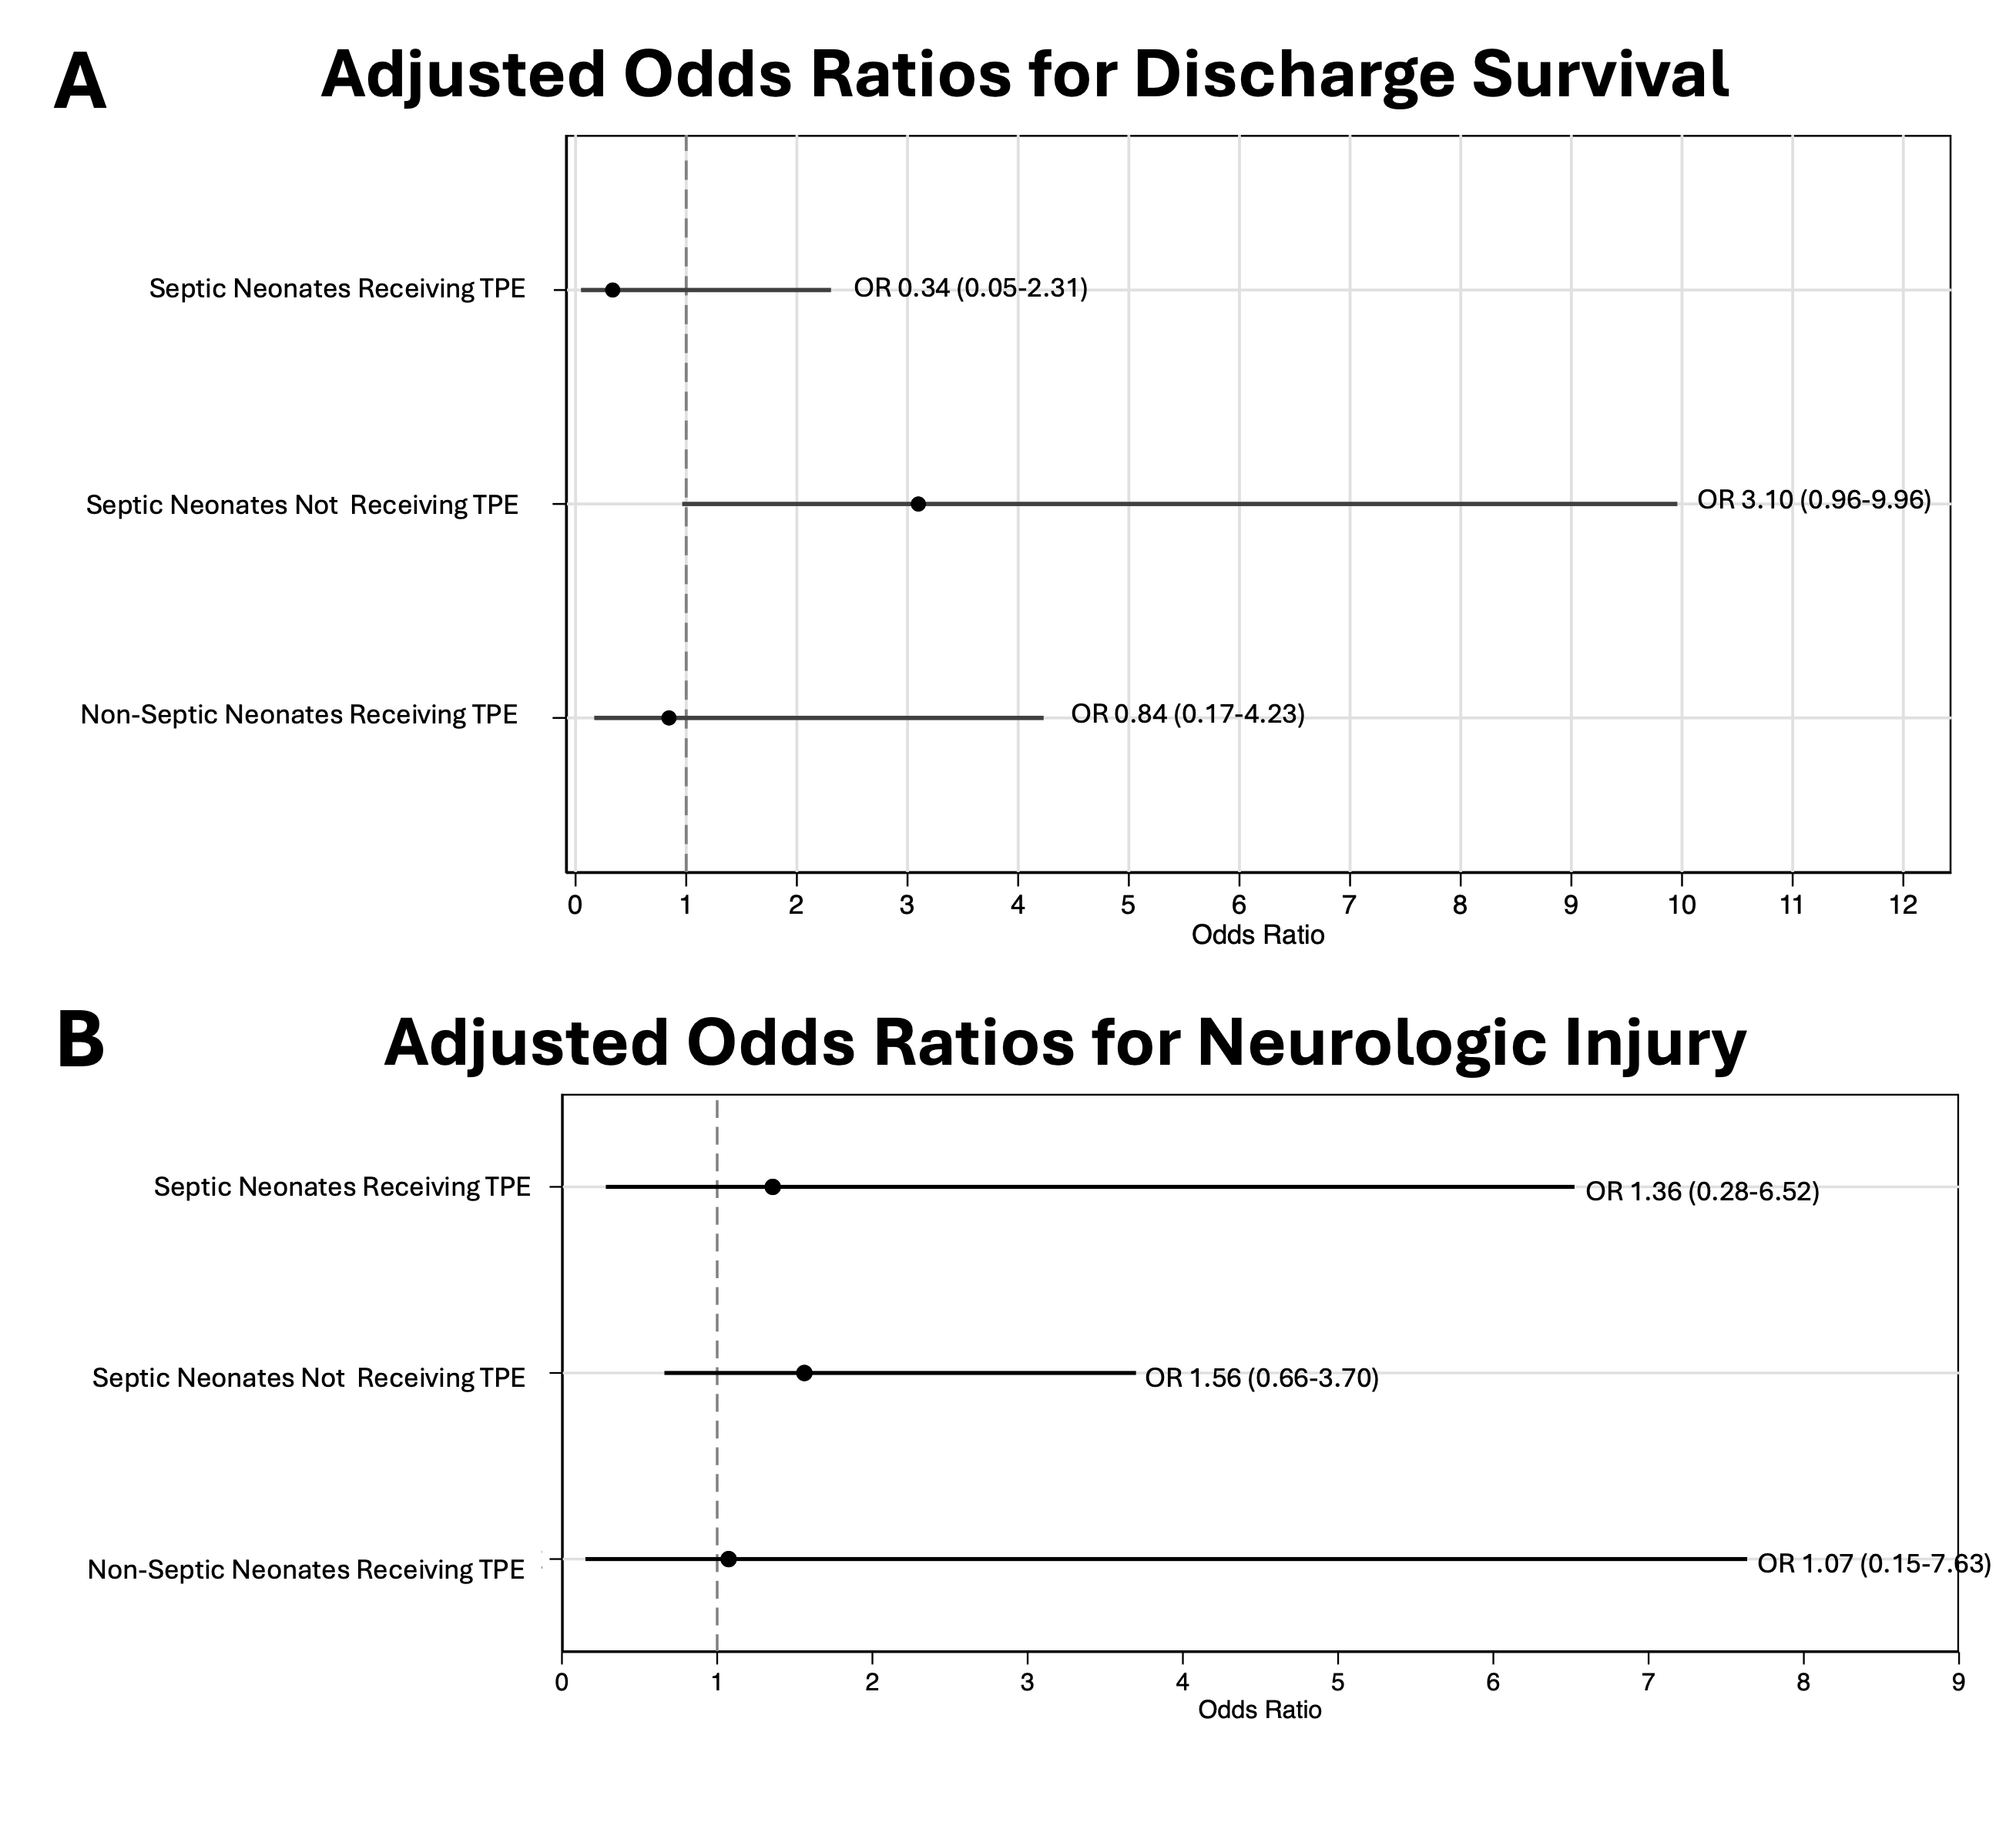 Figure 1A. Forest plot demonstrating the adjusted odds ratios (95% CI) for discharge survival among neonatal ECMO subgroups. Odds ratios are shown relative to the reference group of non-septic neonates who did not receive TPE adjusting for PIPER score and the presence of a confirmed infectious pathogen via culture or PCR. Figure 1B. Forest plot showing the adjusted odds ratios (95% CI) for evidence of neurologic injury on neurodiagnostic imaging in neonatal ECMO subgroups. Odds ratios are shown relative to the reference group of non-septic neonates who did not receive TPE adjusting for noted any neuroimaging abnormality prior to initiation of ECMO or prior to apheresis but after cannulation.