
Nephrology
Session: Nephrology 1
 photo")
Edward Zitnik, DO (he/him/his)
Pediatric Nephrologist
University of Connecticut School of Medicine
West Hartford, Connecticut, United States
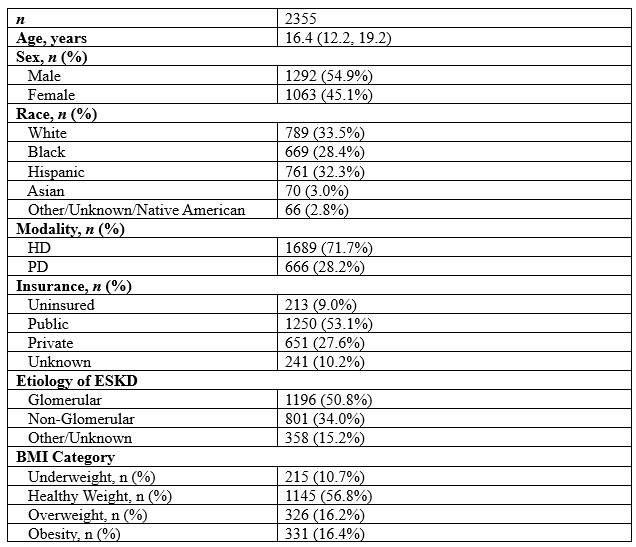 Categorical values are presented as frequency (percentages) and compared using Chi-square test. Continuous variables are presented as the median (interquartile range).
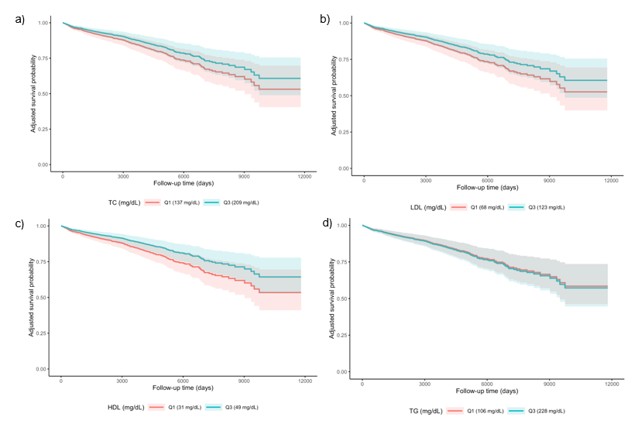 Survival curves controlled for clinical and demographic characteristics held at typical values (age at median; sex, race, ESKD etiology, dialysis modality at modal levels; BMI at modal group; albumin at median). Red curve represents 1st quartile for the lipid level and blue curve represents the 3rd quartile of the lipid level and modeled for survival probability over time. a) TC, b) LDL-C, c) HDL-C, d) TG.
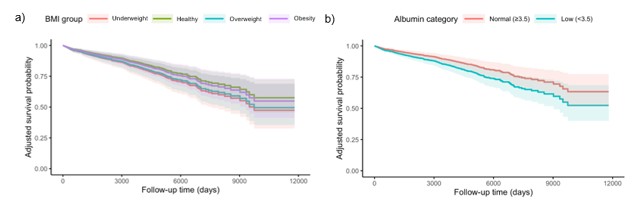 Survival curves controlled for clinical and demographic characteristics held at typical values (age at median; sex, race, ESKD etiology, dialysis modality at modal levels; BMI at modal group for albumin curve; albumin at median for BMI curve). a) red curve represents underweight, green curve represents healthy weight, blue curve represents overweight, and purple curve represents obesity modeled for survival probability over time. b) red curve represents normal serum albumin ≥3.5 g/dL and blue curve represents low serum albumin <3.5 g/dL modeled for survival probability over time.