
Asthma
Session: Asthma 1
 photo")
Nidhya Navanandan, MD, MSCS (she/her/hers)
Associate Professor of Pediatrics
University of Colorado School of Medicine
Aurora, Colorado, United States
.jpg) A) A heat map of 104 network genes as expressed among the study cohort, hierarchically clustered into T1-low (T1-L), T1-medium (T1-M), and T1-high (T1H) groups. B) Similar to A but based on 19 T2 network genes.
A) A heat map of 104 network genes as expressed among the study cohort, hierarchically clustered into T1-low (T1-L), T1-medium (T1-M), and T1-high (T1H) groups. B) Similar to A but based on 19 T2 network genes. 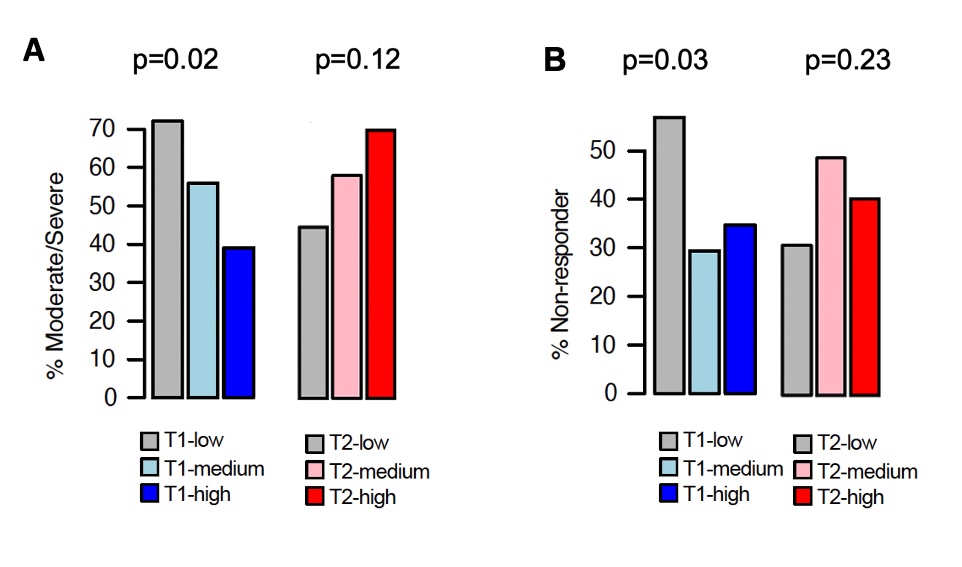 A) Bar plot depicting percentage of patients with moderate/severe exacerbations by T1 and T2 status. B) Bar plot depicting percentage of patients with treatment response by T1 and T2 status.