
Neonatal Fetal Nutrition & Metabolism
Session: Neonatal Fetal Nutrition & Metabolism 3
.jpg "Carmen Monthe-dreze, MD (she/her/hers) photo")
Carmen Monthe-dreze, MD (she/her/hers)
Neonatologist
Women & Infants Hospital of Rhode Island
Providence, Rhode Island, United States
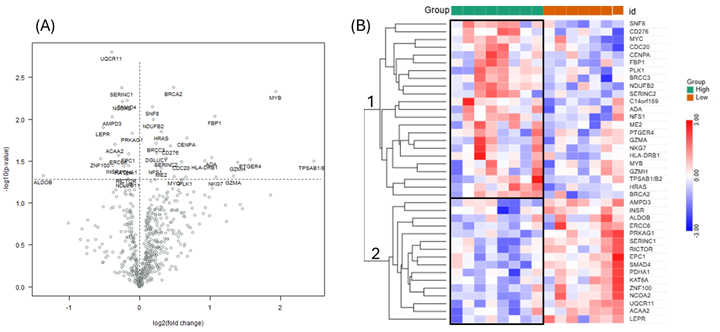 (A) Volcano plot of differentially expressed genes in placentae with high (n=8) vs. low (n=7) 14-HDoHE concentrations with absolute FC < or > |1| and P-value < 0.05. The x-axis represents log2 fold change (log2 FC), and the y-axis represents -log10 (P-value). Green dots indicate the 23 upregulated genes in placentae with high vs. low 14-HDoHe, and purple dots indicate the 16 downregulated genes in placentae with high vs. low 14-HDoHE. The differential expression analysis did not meet significance threshold after correction for FDR. (B) Heatmap shows unsupervised hierarchical cluster analysis of placentae metabolic transcriptome data using the Euclidean distance method with average linkage. All 39 genes differentially expressed in placentae with high vs. low 14-HDoHE were included in the heatmap with relative expression displayed as normalized and scaled z-scores. Red indicates a high expression level; blue indicates a low expression level. Unsupervised hierarchical clustering led to 2 gene clusters.
 1There were 39 significant differentially regulated genes in placenta with high vs. low 14-HDoHE (P-value < 0.05). However, comparison did not meet FDR (P-Adj > 0.05). Upregulated genes belonged to cluster 1, and downregulated genes to cluster 2.
 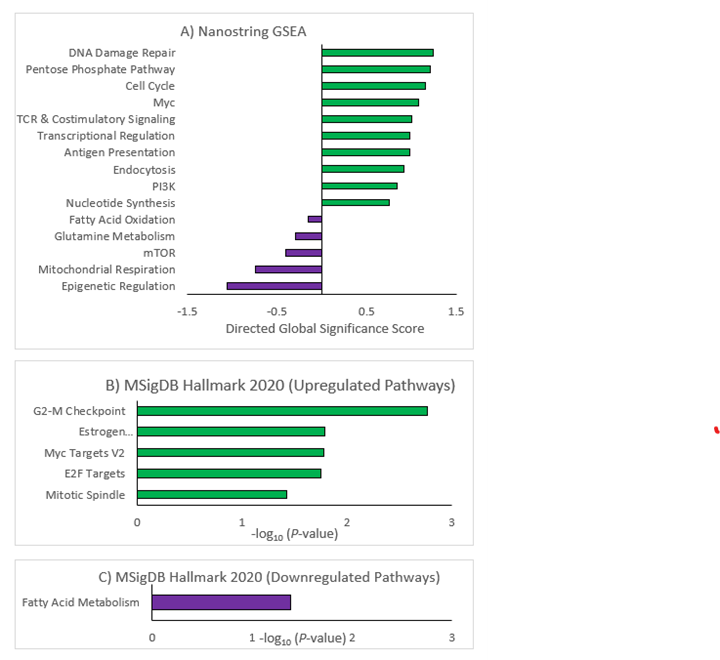 (A) Direct global significance score from Nanostring GSEA based on the differential expression testing of placentae with high vs. low 14-HDOHE concentrations. Direct global significance scores measure the extent to which a given geneset is up- or down-regulated relative to a given exposure by summarizing the statistical significance of all genes in the geneset and is calculated as the square root of the mean signed squared t-statistics. A higher score indicates that a larger proportion of the genes in the geneset exhibits changes in expression relative to a given exposure. MSigDB Pathway analysis of (B) the 23 significantly upregulated genes (cluster 1) and (C) the 16 significantly downregulated genes (cluster 2) in placentae with high vs low concentrations of 14-HDOHE. The reference (background) genes included all the genes measured in the experiment. P-value for all pathways < 0.05.