
Pediatric Nutrition
Session: Pediatric Nutrition
 photo")
Sudarshan Jadcherla, MD, FRCP, DCH, AGAF (he/him/his)
Professor of Pediatrics
Nationwide Children's Hospital
Columbus, Ohio, United States
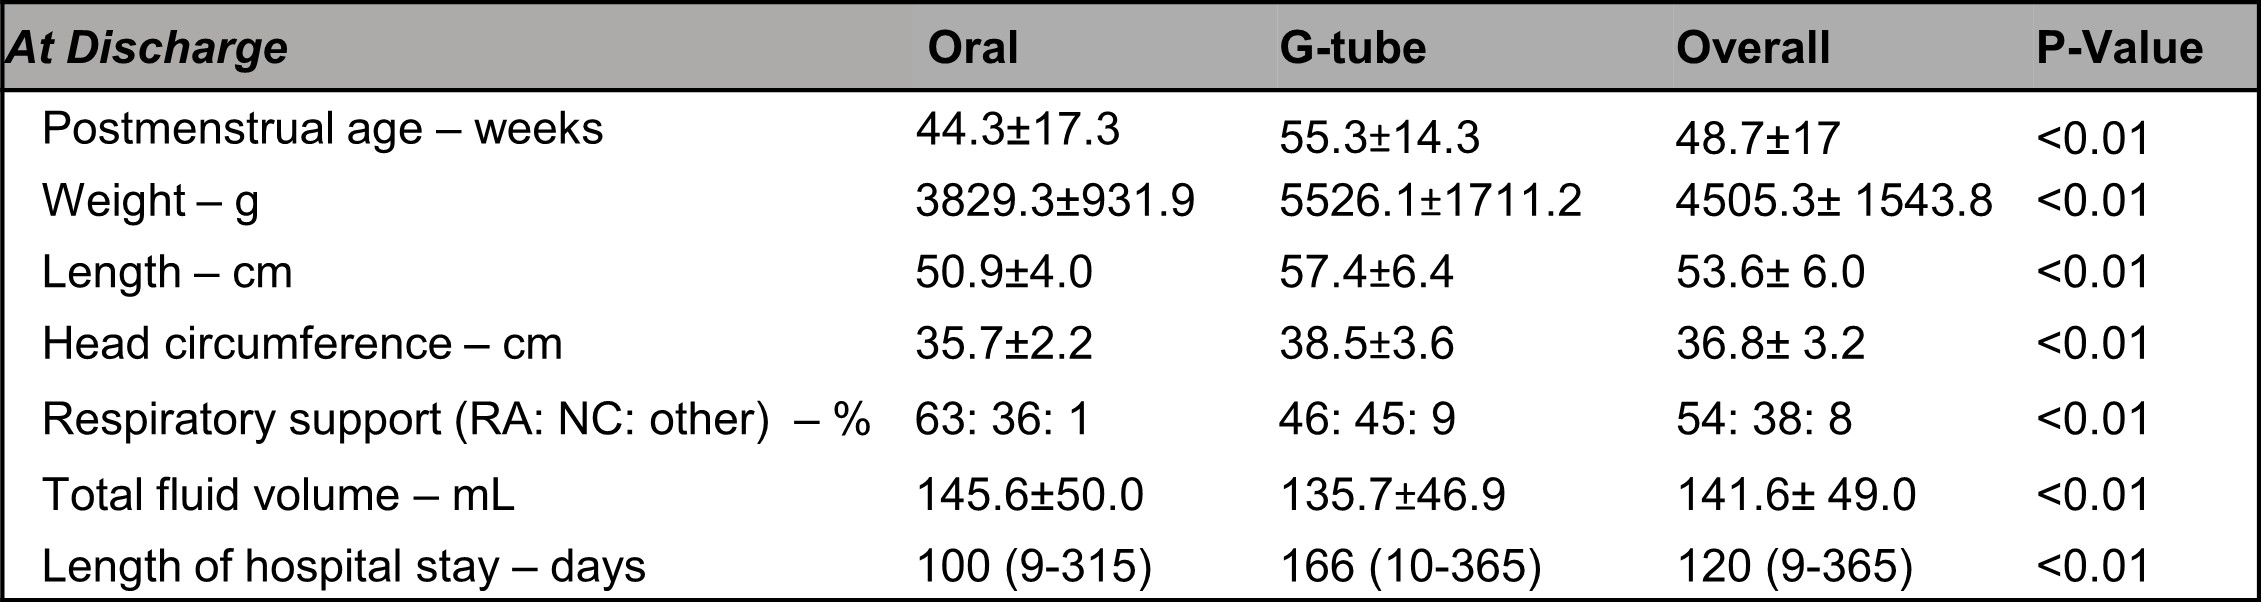 Data is presented as mean ± SD, %, and median (min-max).
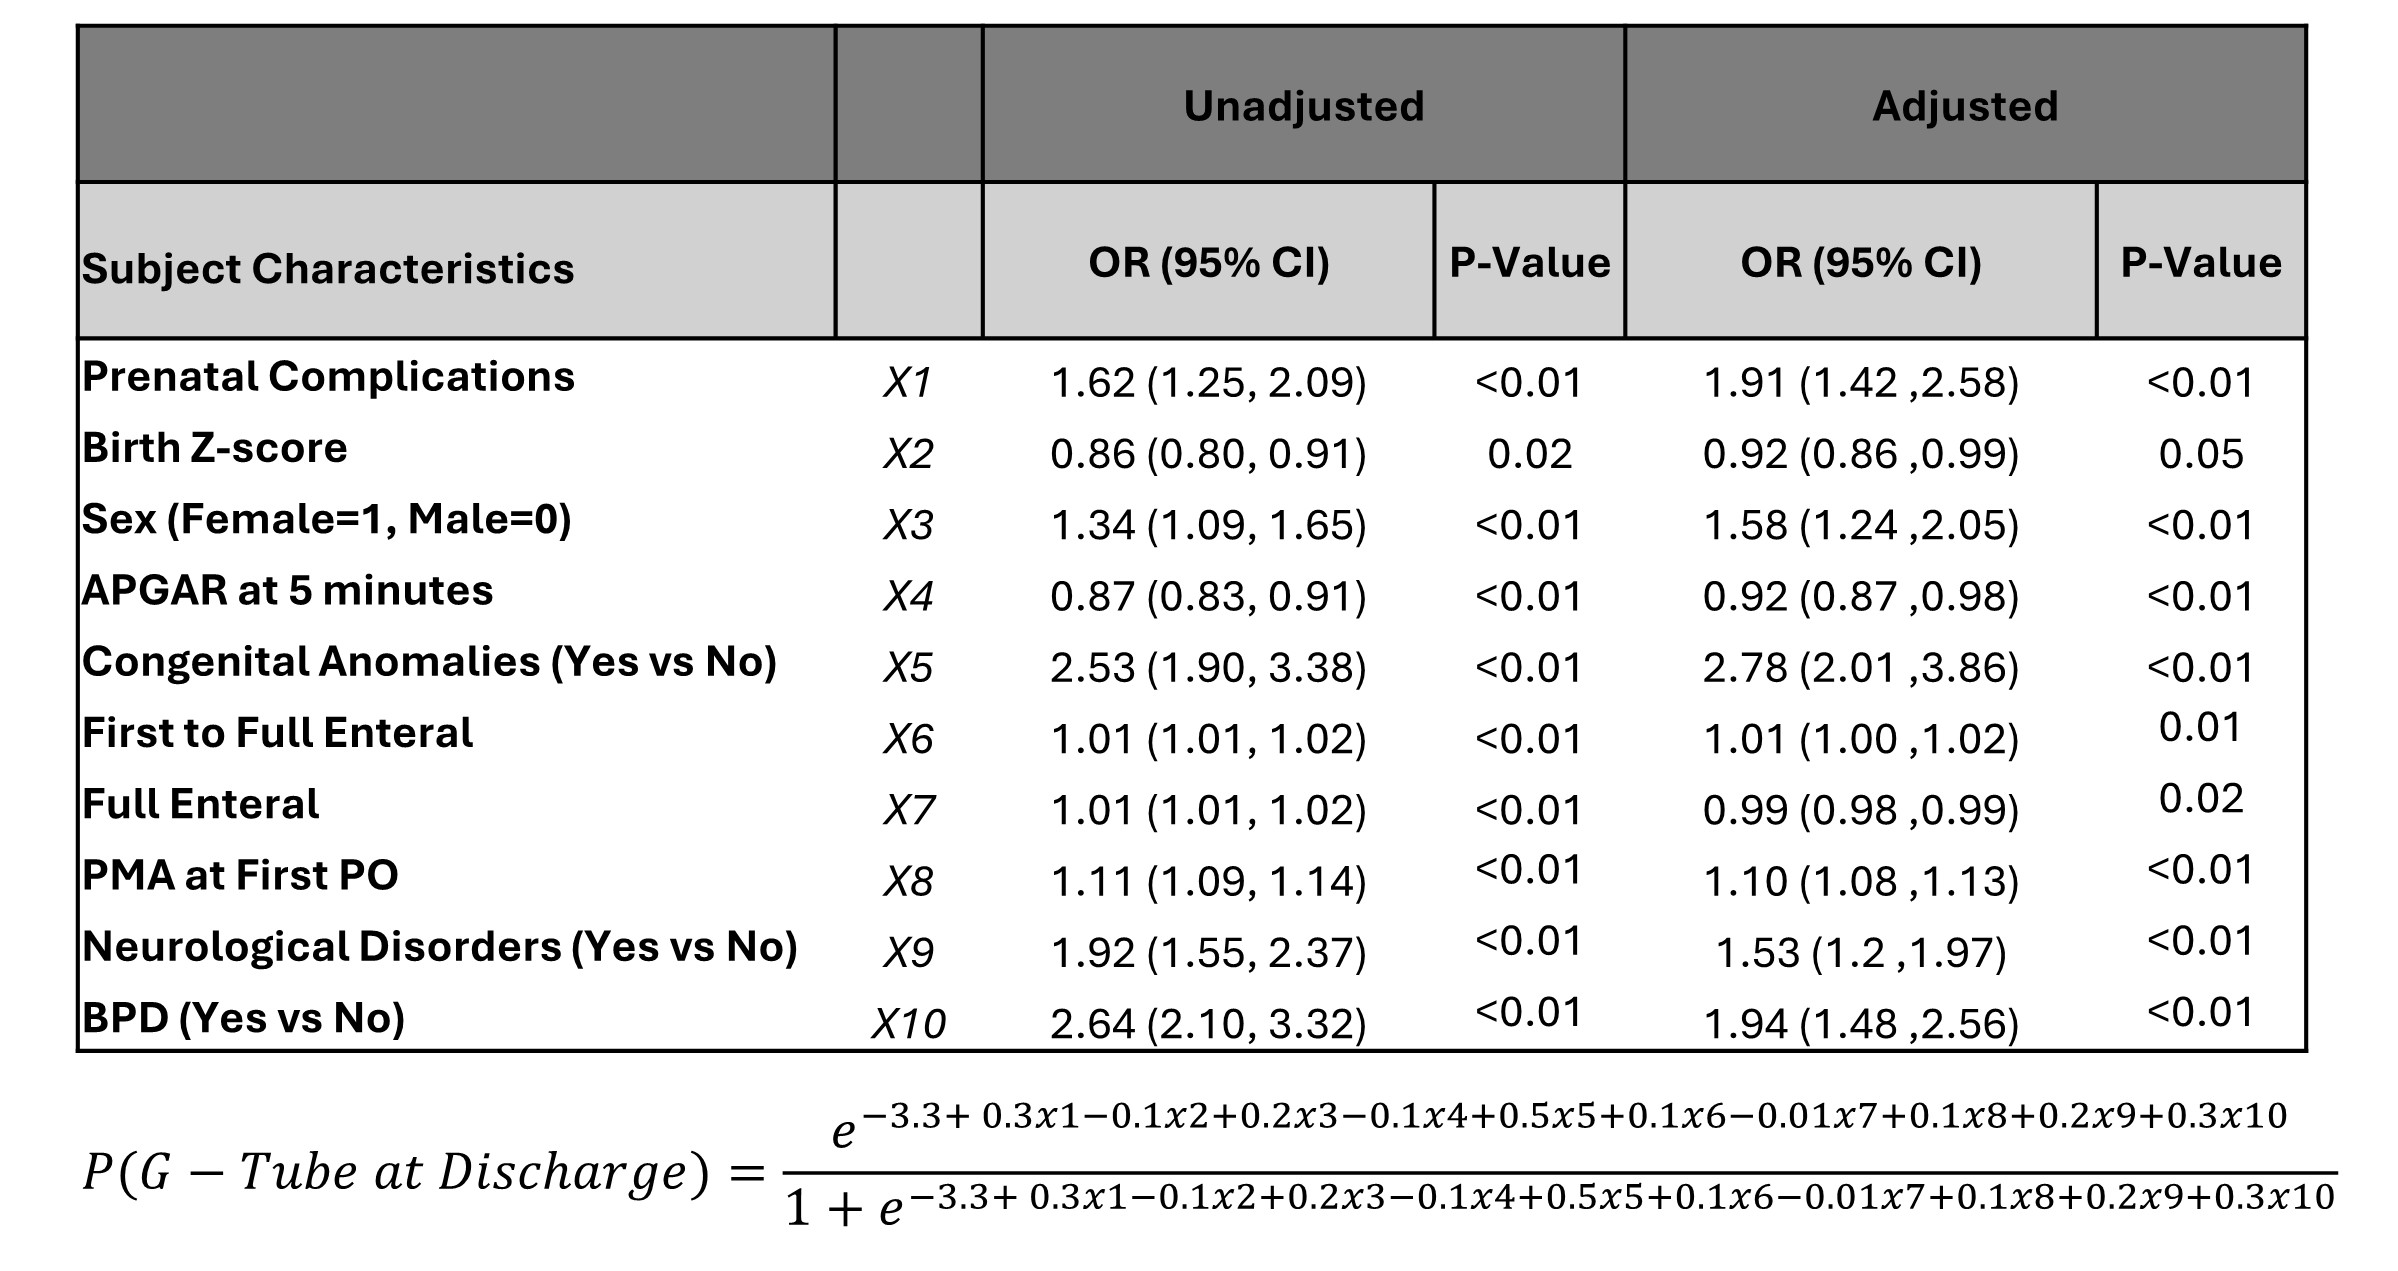 Odds ratios (OR) and confidence intervals (CI) were estimated using unadjusted and multivariable logistic regression models to predict exclusive G-tube feeding at discharge. Unadjusted models assessed each predictor individually, while adjusted models included all covariates simultaneously. Variables X1-X10 represent subject characteristics included in the regression formula for brevity. For example, an infant with the following characteristics-2 parental complications, birth weight z-score of -1, female sex, 5-minute APGAR of 4, presence of congenital anomalies and neurological disorders, achievement of full enteral feeding by day 14 of life, a 10-day interval from first enteral feeding to first oral feeding, and first oral feeding achieved at 34 weeks postmenstrual age-had an estimated 81% probability of being discharged with a G-tube.
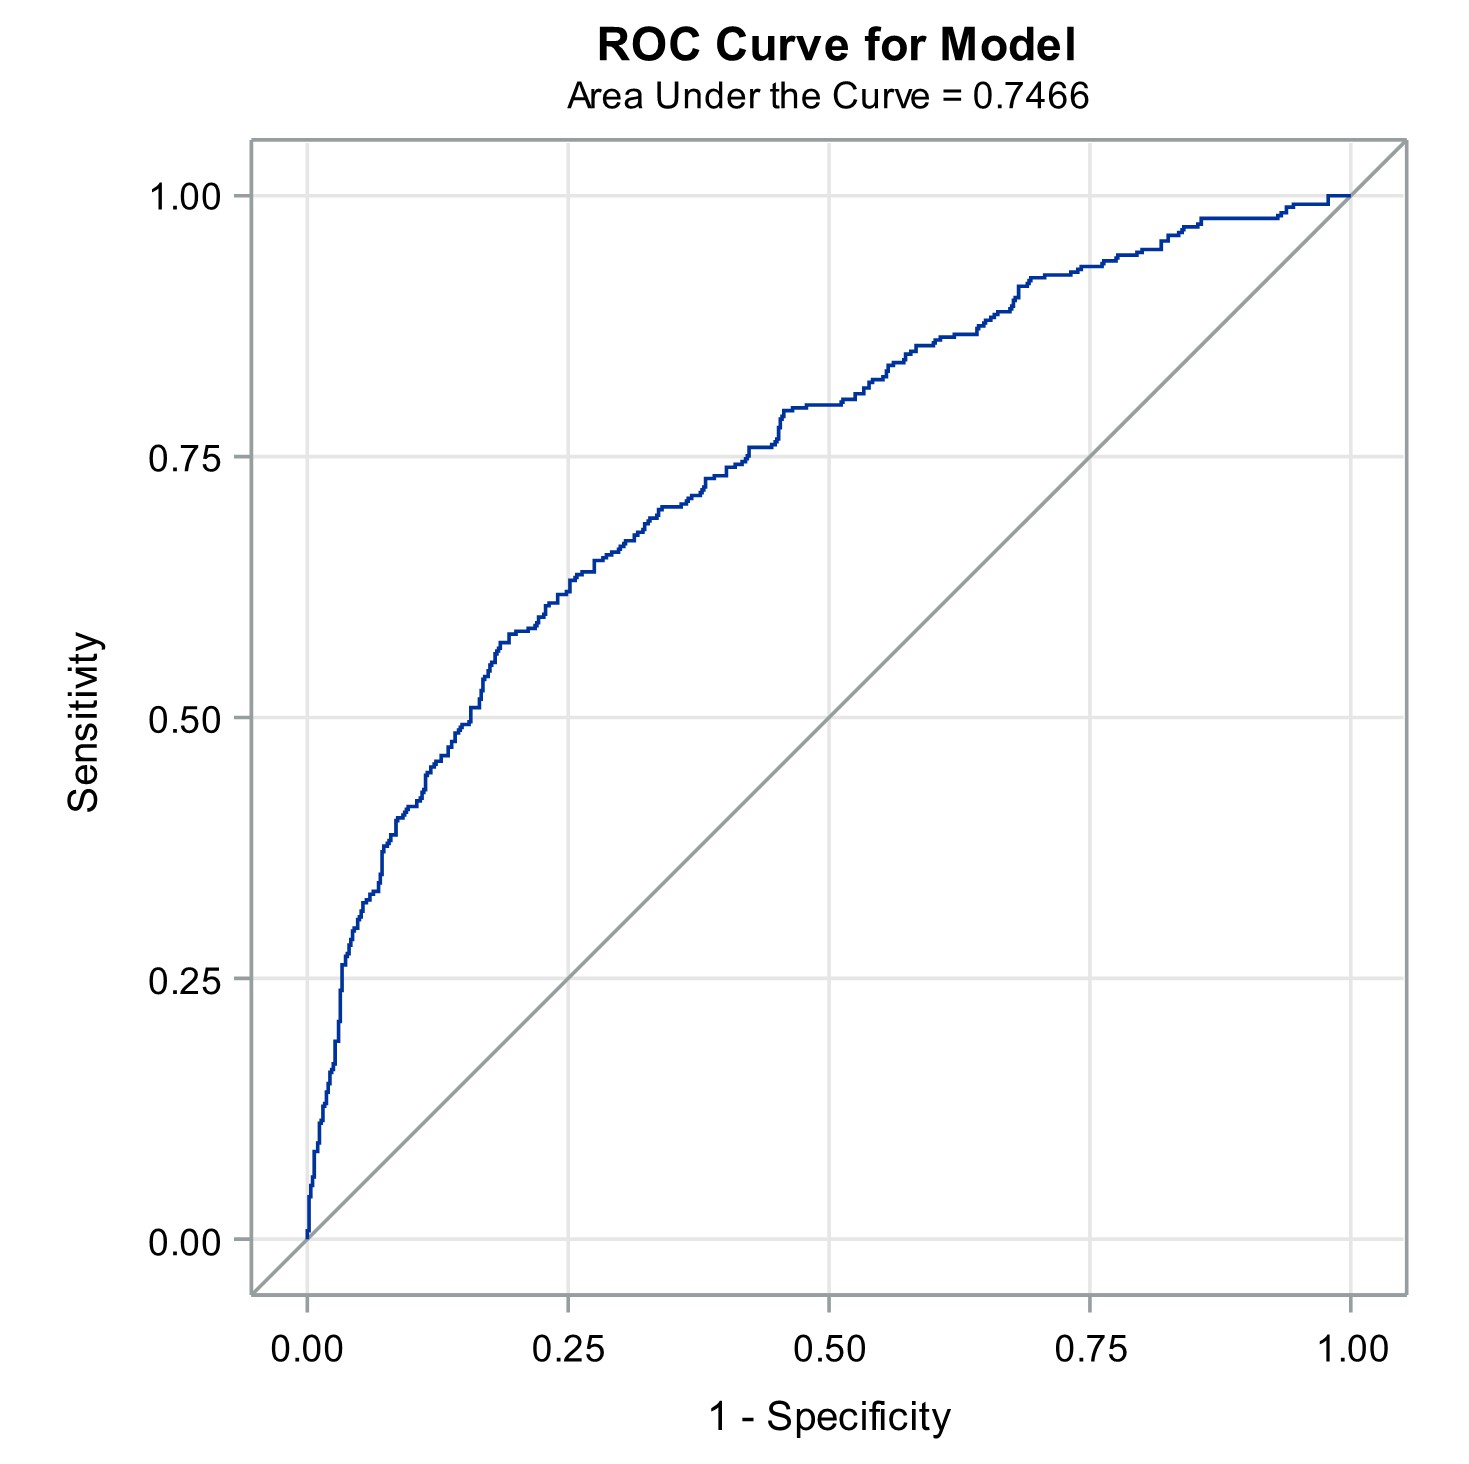 The ROC curve demonstrates the trade-off between sensitivity and 1 − specificity. The area under the curve (AUC) was 0.75, indicating moderate to good discriminatory performance. The diagonal gray line indicates the reference line of random classification (AUC = 0.5).