
Neonatal Follow-up
Session: Neonatal Follow-up 3
 photo")
Sara K. Neches, MD (she/her/hers)
Assistant Professor of Pediatrics, Division of Neonatology
University of Washington School of Medicine
University of Washington
Seattle, Washington, United States
.png) Lines indicate significant associations between parameters from negative (red) to positive (blue). Thickness of the line indicates the magnitude of the association. Each variable is adjusted for the others in the graphical network model. Notably, only decreasing SVI and increasing CRIB-II score were significantly associated with NDFU within the first 12 months CA. N=145 infants were analyzed within the graphical network.
Lines indicate significant associations between parameters from negative (red) to positive (blue). Thickness of the line indicates the magnitude of the association. Each variable is adjusted for the others in the graphical network model. Notably, only decreasing SVI and increasing CRIB-II score were significantly associated with NDFU within the first 12 months CA. N=145 infants were analyzed within the graphical network.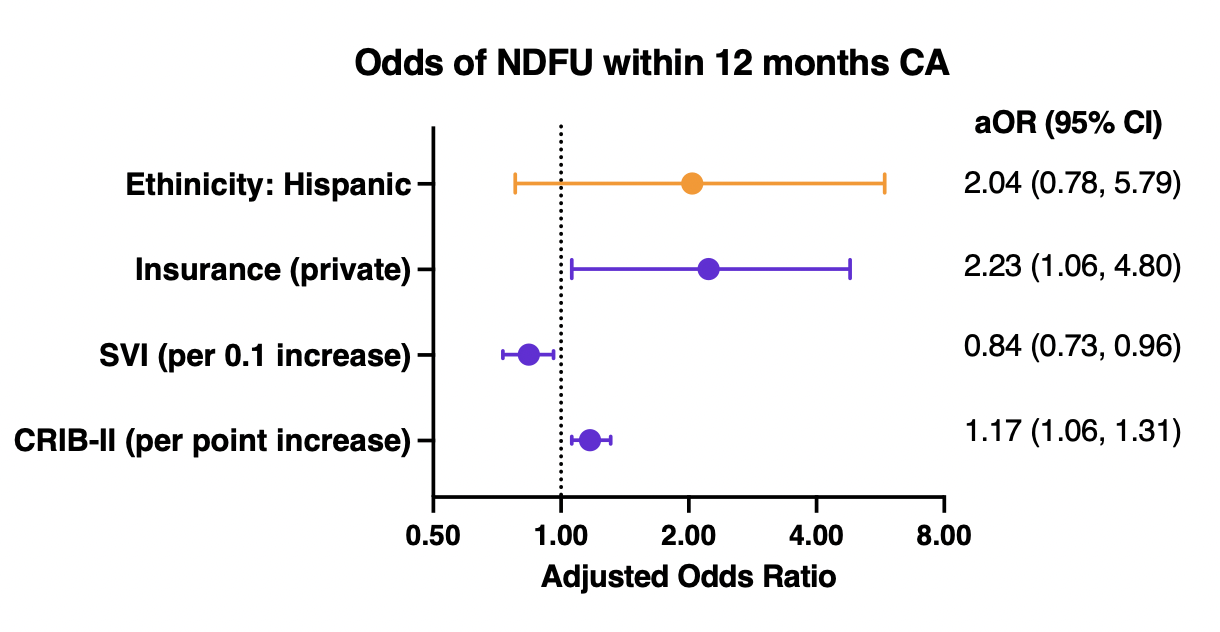 Of note, SVI, CRIB-II score, Hispanic ethnicity, and private insurance were selected by the forward step AIC regression model which initially included all variables within the graphical network analysis (Figure 1). For continuous variables, it is the aOR per increase in 1 unit. For every 1-point increase in CRIB-II score, there was 17% increased odds of NDFU before 12 months CA. Of note, SVI was multiplied by 10 in the regression model; therefore, for every 0.1-point increase in SVI, there was 16% reduced odds of attending NDFU within the first 12 months CA. NDFU: neurodevelopmental follow-up. aOR: adjusted odds ratio. CI: confidence interval. SVI: Social Vulnerability Index (SVI). Purple shows significant associations and orange is not significant. aOR: adjusted odds ratio. CI: confidence interval. SVI: Social Vulnerability Index (SVI).