
Neonatal General
Session: Neonatal General 10: In Utero Exposures
 photo")
Sara Manetta, MD (she/her/hers)
Neonatology Fellow
University of Virginia School of Medicine
Charlottesville, Virginia, United States
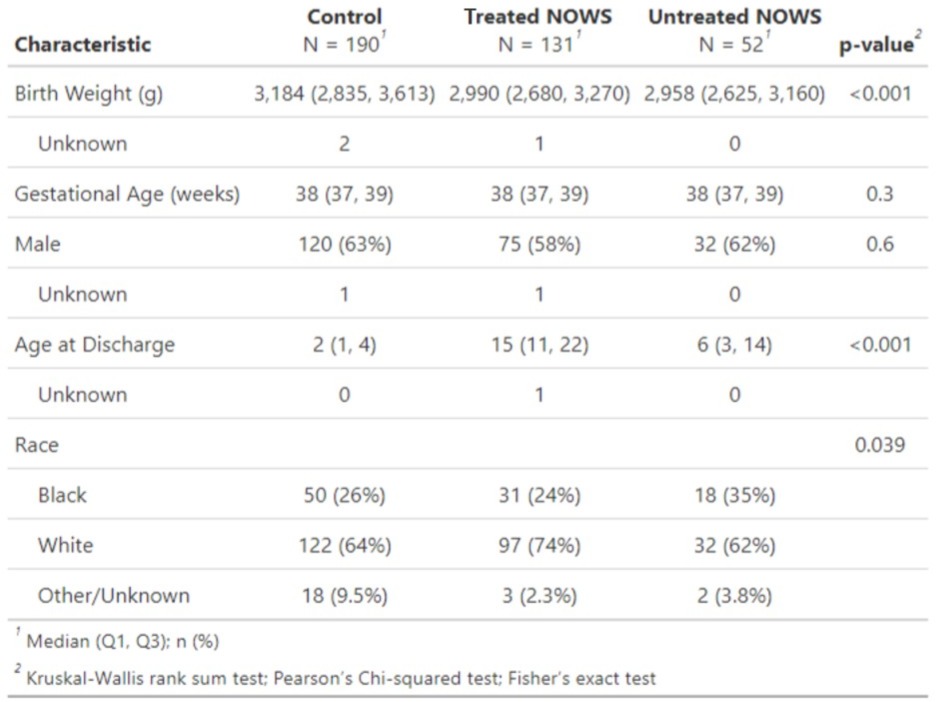 Patient demographics are grouped comparing controls, treated NOWS infants, and untreated NOWS infants. Categorical variables are summarized as N (%) and continuous variables as median (IQR). Groups were compared using Kruskal-Wallis rank sum tests, Pearson's Chi-squared tests and Fisher exact tests.
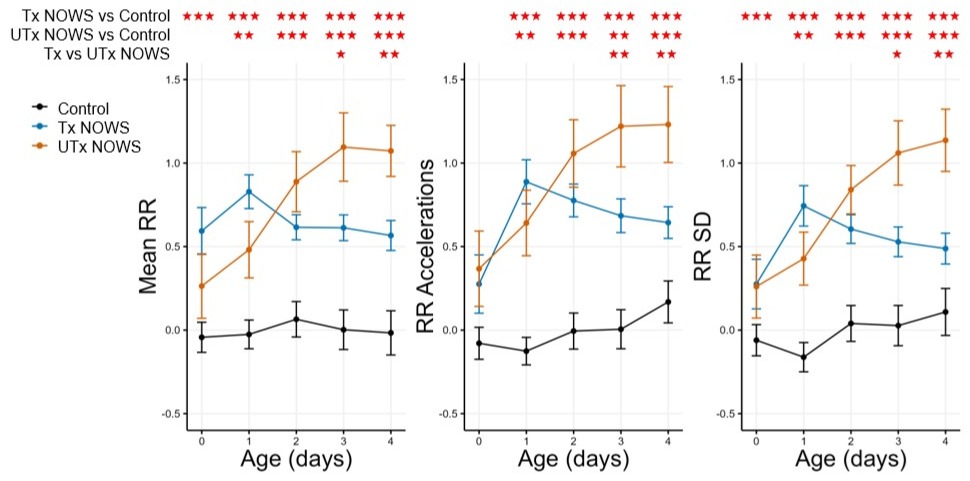 RR metrics over the first five days after birth by NOWS group, including control infants, treated NOWS infants (Tx NOWS), and untreated NOWS (UTx NOWS) infants. The metrics are displayed as the mean z-scores. RR accelerations are calculated by subtracting the mean RR from max RR, representing variability above the mean. Error bars represent the standard error of the mean (SEM). A z-score of 0 corresponds to the control group mean, while positive values indicate how many standard deviations a group's mean is above the control group mean. The data suggest that treated and untreated NOWS infants have higher and more variable respiratory rates than control infants. Asterisks indicate times respiratory features were significantly different between groups. *p < 0.05, **p < 0.01, ***p < 0.001.
 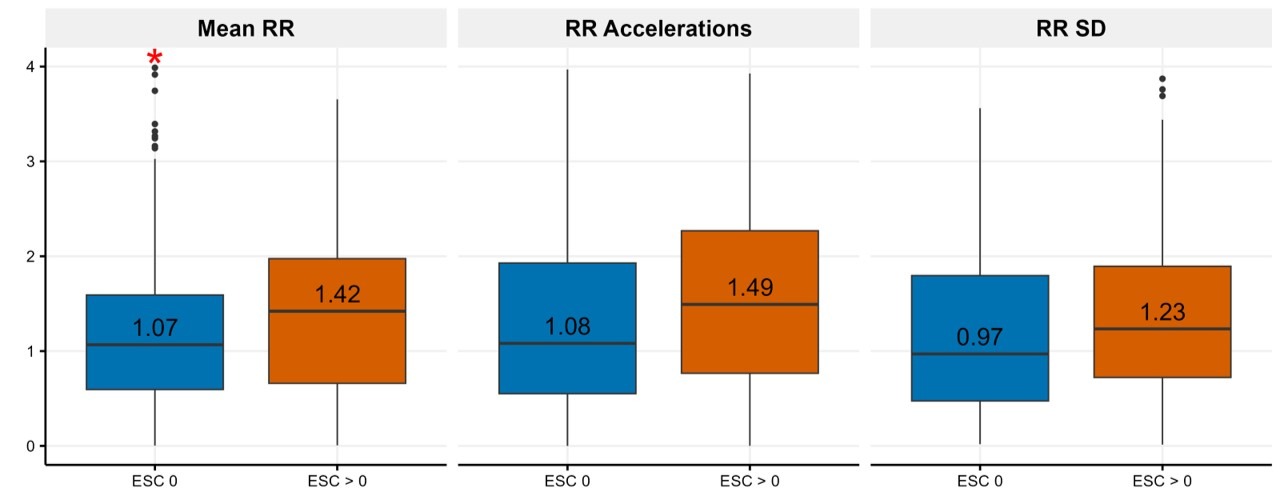 Normalized RR metric values by the ESC score. The RR metrics are displayed as z-scores. A z-score of 0 corresponds to the control group mean, while positive values indicate how many standard deviations a group's mean is above the control group mean. 56 NOWS infants had ESC scores recorded during the first 28 days of their admission. When ESC scores contained all "yes" components (blue), ESC was considered 0; when ESC scores contained at least 1 "no" component, ESC was considered > 0 (brown). In each box, the horizontal line denotes the median value; boxes extend from the 25th to the 75th percentile of each group's distribution of values; vertical extending lines denote more extreme values within 1.5 x the interquartile range; dots denote observations outside that range. The asterisk indicates that mean RR was significantly higher at times infants' ESC scores were > 0 compared to times their scores were 0 (*p < 0.05).