
Neonatal Quality Improvement
Session: Neonatal Quality Improvement 6
 photo")
Nisha Dalvie, MD (she/her/hers)
Neonatal Fellow
Boston Children's Hospital
Somerville, Massachusetts, United States
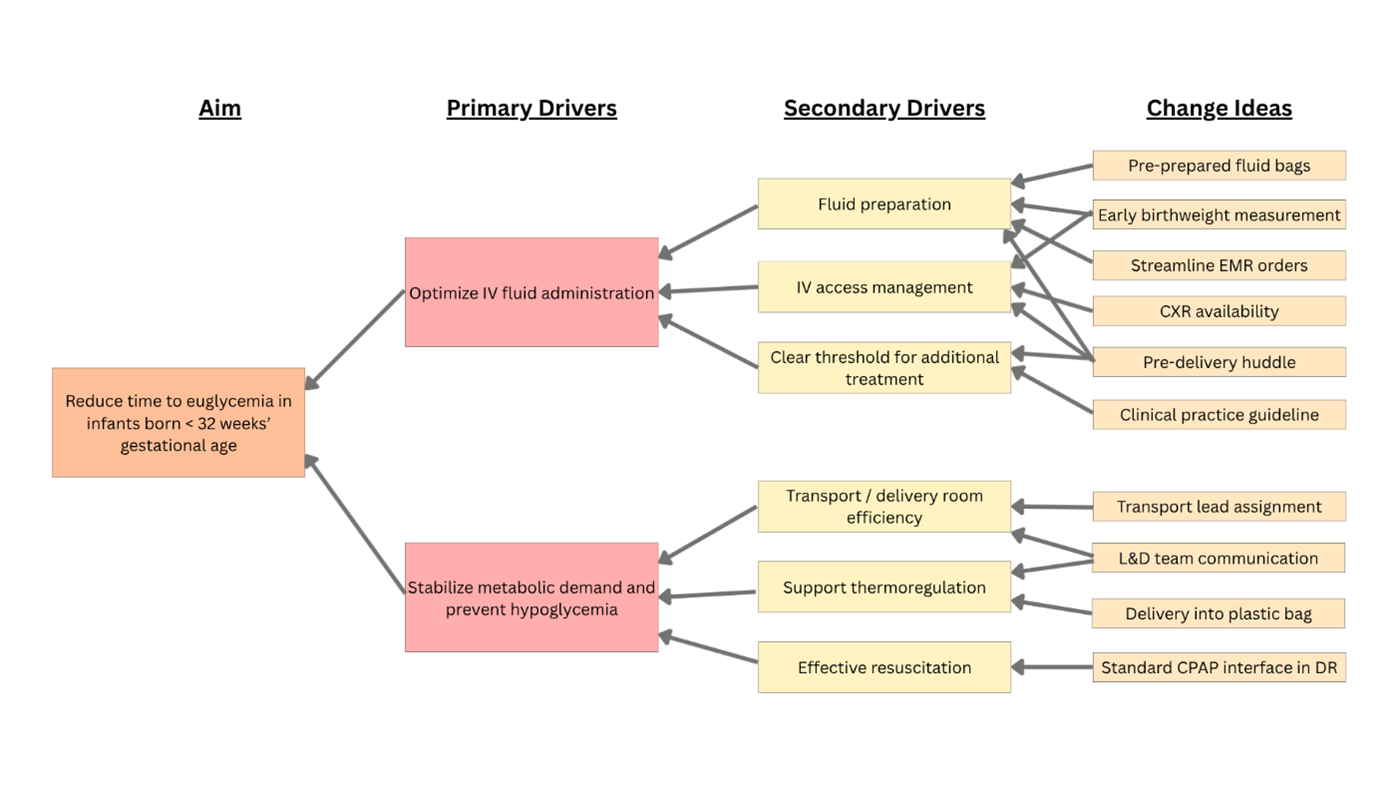 A drive diagram demonstrating the primary and secondary drivers of time to euglycemia in high-risk infants with proposed change ideas mapped to each driver.
 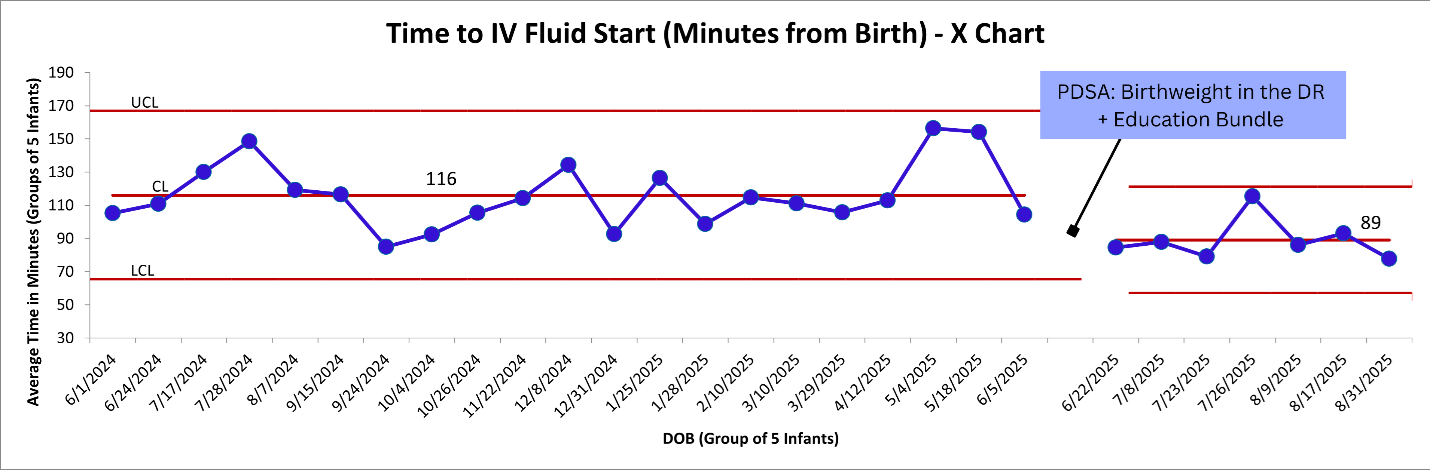 An X chart demonstrating average time to IV fluid start (in minutes from birth). Each point represents the average value for a group of 5 infants born starting from the date listed. The date of this PDSA cycle is indicated on the graph along with the change in center line.