
Neonatal Pulmonology
Session: Neonatal Pulmonology - Clinical Science 7: Mechanical Ventilation, Respiratory Support, Congenital Lung Anomalies
 photo")
William Ashe, PhD (he/him/his)
Research Assistant Professor of Medicine
University of Virginia School of Medicine
Charlottesville, Virginia, United States
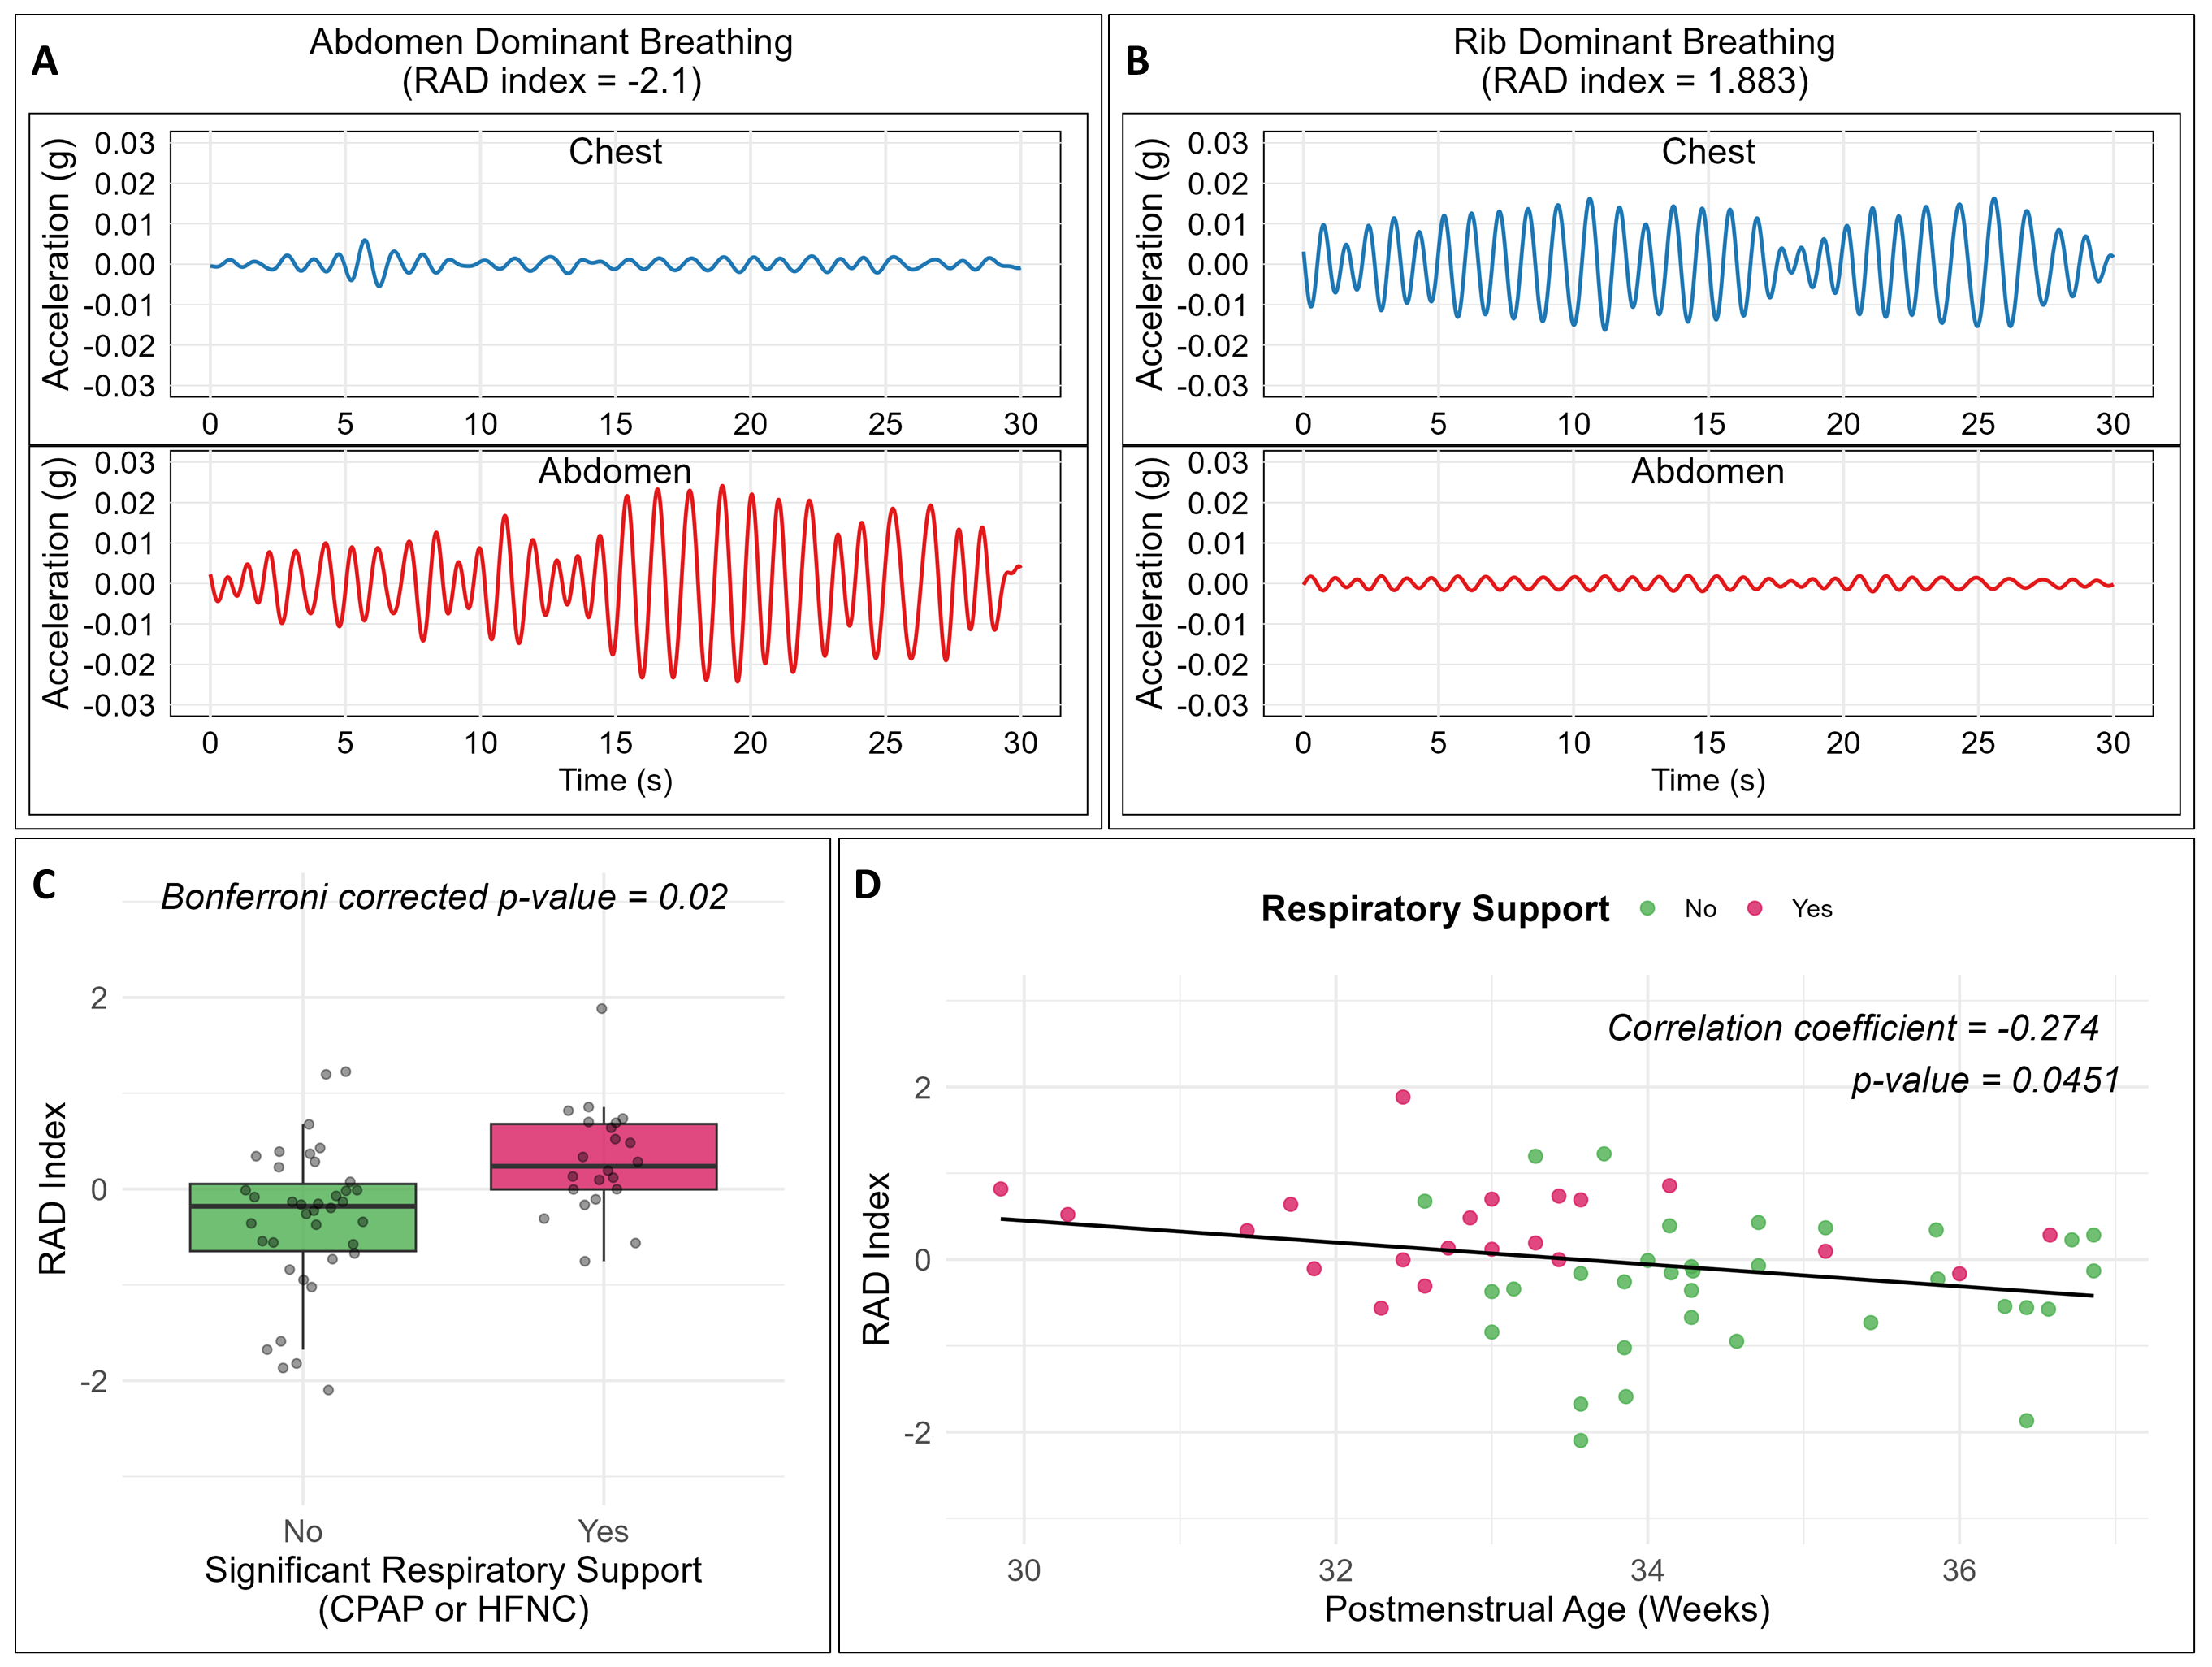 Panel A shows the kinematics of a neonate that was not requiring any respiratory support [Postmenstrual age (PMA) = 33.6 weeks; RR = 53 bpm]. Panel B shows the kinematics of a neonate requiring CPAP [PMA = 32.4 weeks; RR = 58 bpm]. [For visual clarity, only one accelerometer axis is shown in Panels A-B; the RAD Index is derived from 3-axis accelerometer data.] Despite similar PMA and RR, the infants in panels A & B exhibit a markedly different RAD Index. In the neonate requiring CPAP, the rib amplitude exceeds abdominal amplitude, yielding a positive RAD Index (+1.9). In the neonate not requiring any support, the opposite pattern (i.e., abdominal dominance) is displayed, resulting in a negative RAD Index (-2.1). Panel C shows a higher distribution of RAD index measurements among preterm infants on respiratory support compared to those not on respiratory support (p < 0.05 after Bonferroni correction for multiple comparisons). Panel D shows the RAD index plotted as a function of PMA with a negative correlation, indicating more rib-dominant breathing kinematics at lower PMA.
 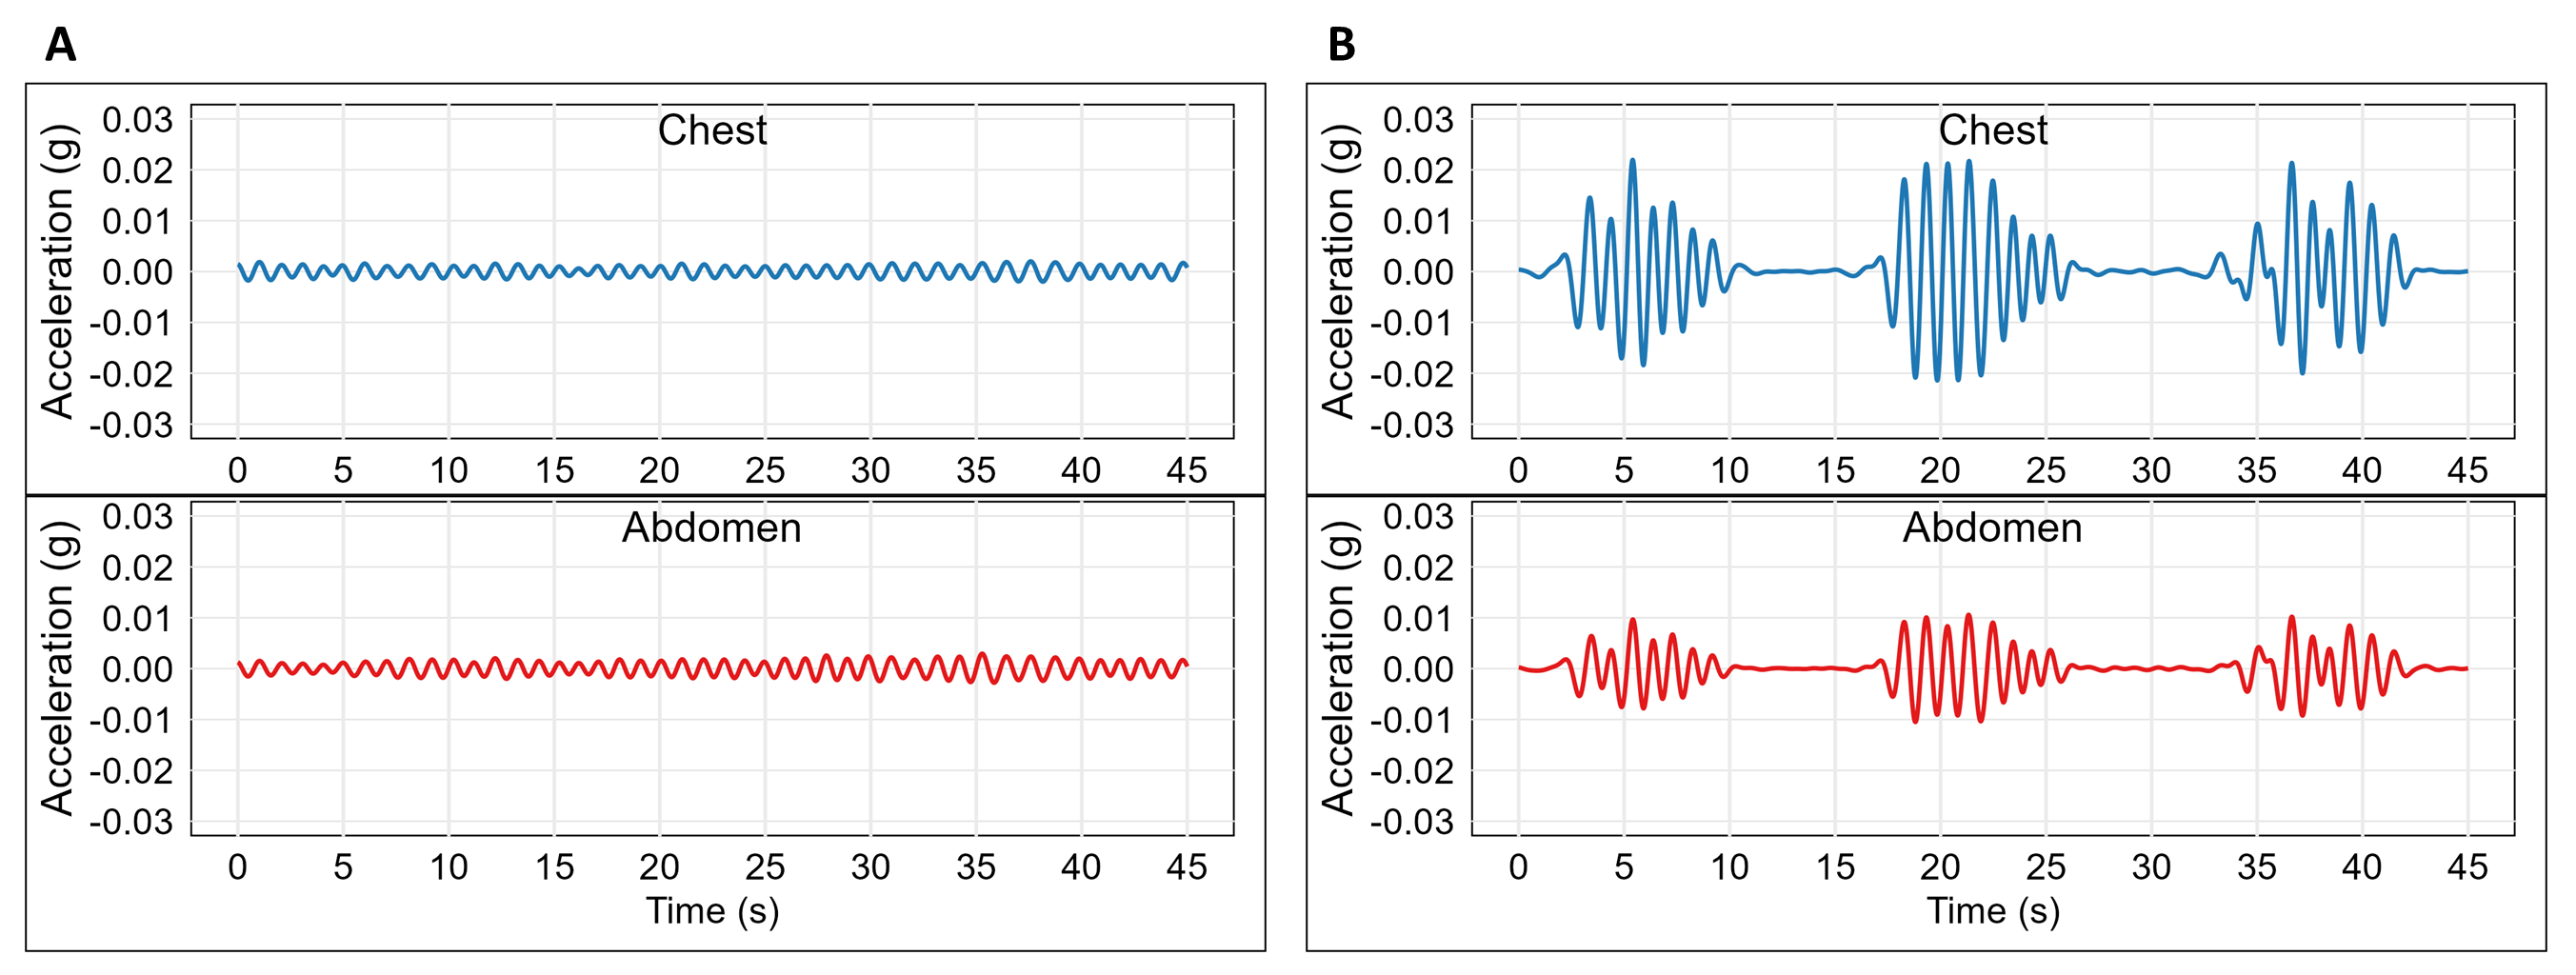 These are representative examples of regular (panel A) and periodic (panel B) breathing patterns observed in exploratory kinematic visualizations. In the periodic breathing example, there are cyclical increases and decreases in signal amplitude during periods of rapid breathing followed by short apneas. In contrast, the example of regular breathing contains neither interval nor amplitude variations. Both of these patterns vary from the signals in Figure 1, where breathing exhibits amplitude modulation without pauses. These examples demonstrate the rich physiological information encoded in thoraco-abdominal kinematics-information not captured by respiratory rate alone. [For visual clarity, only one accelerometer axis is shown; quantitative analyses are performed on 3-axis data.]