
Genomics/Epigenomics
Session: Genomics/Epigenomics 1
 photo")
Karyn Robinson, M.S. (she/her/hers)
Research Laboratory Manager
Nemours Children's Hospital
Nemours Biomedical Research - Alfred I. duPont Hospital for Children
Wilmington, Delaware, United States
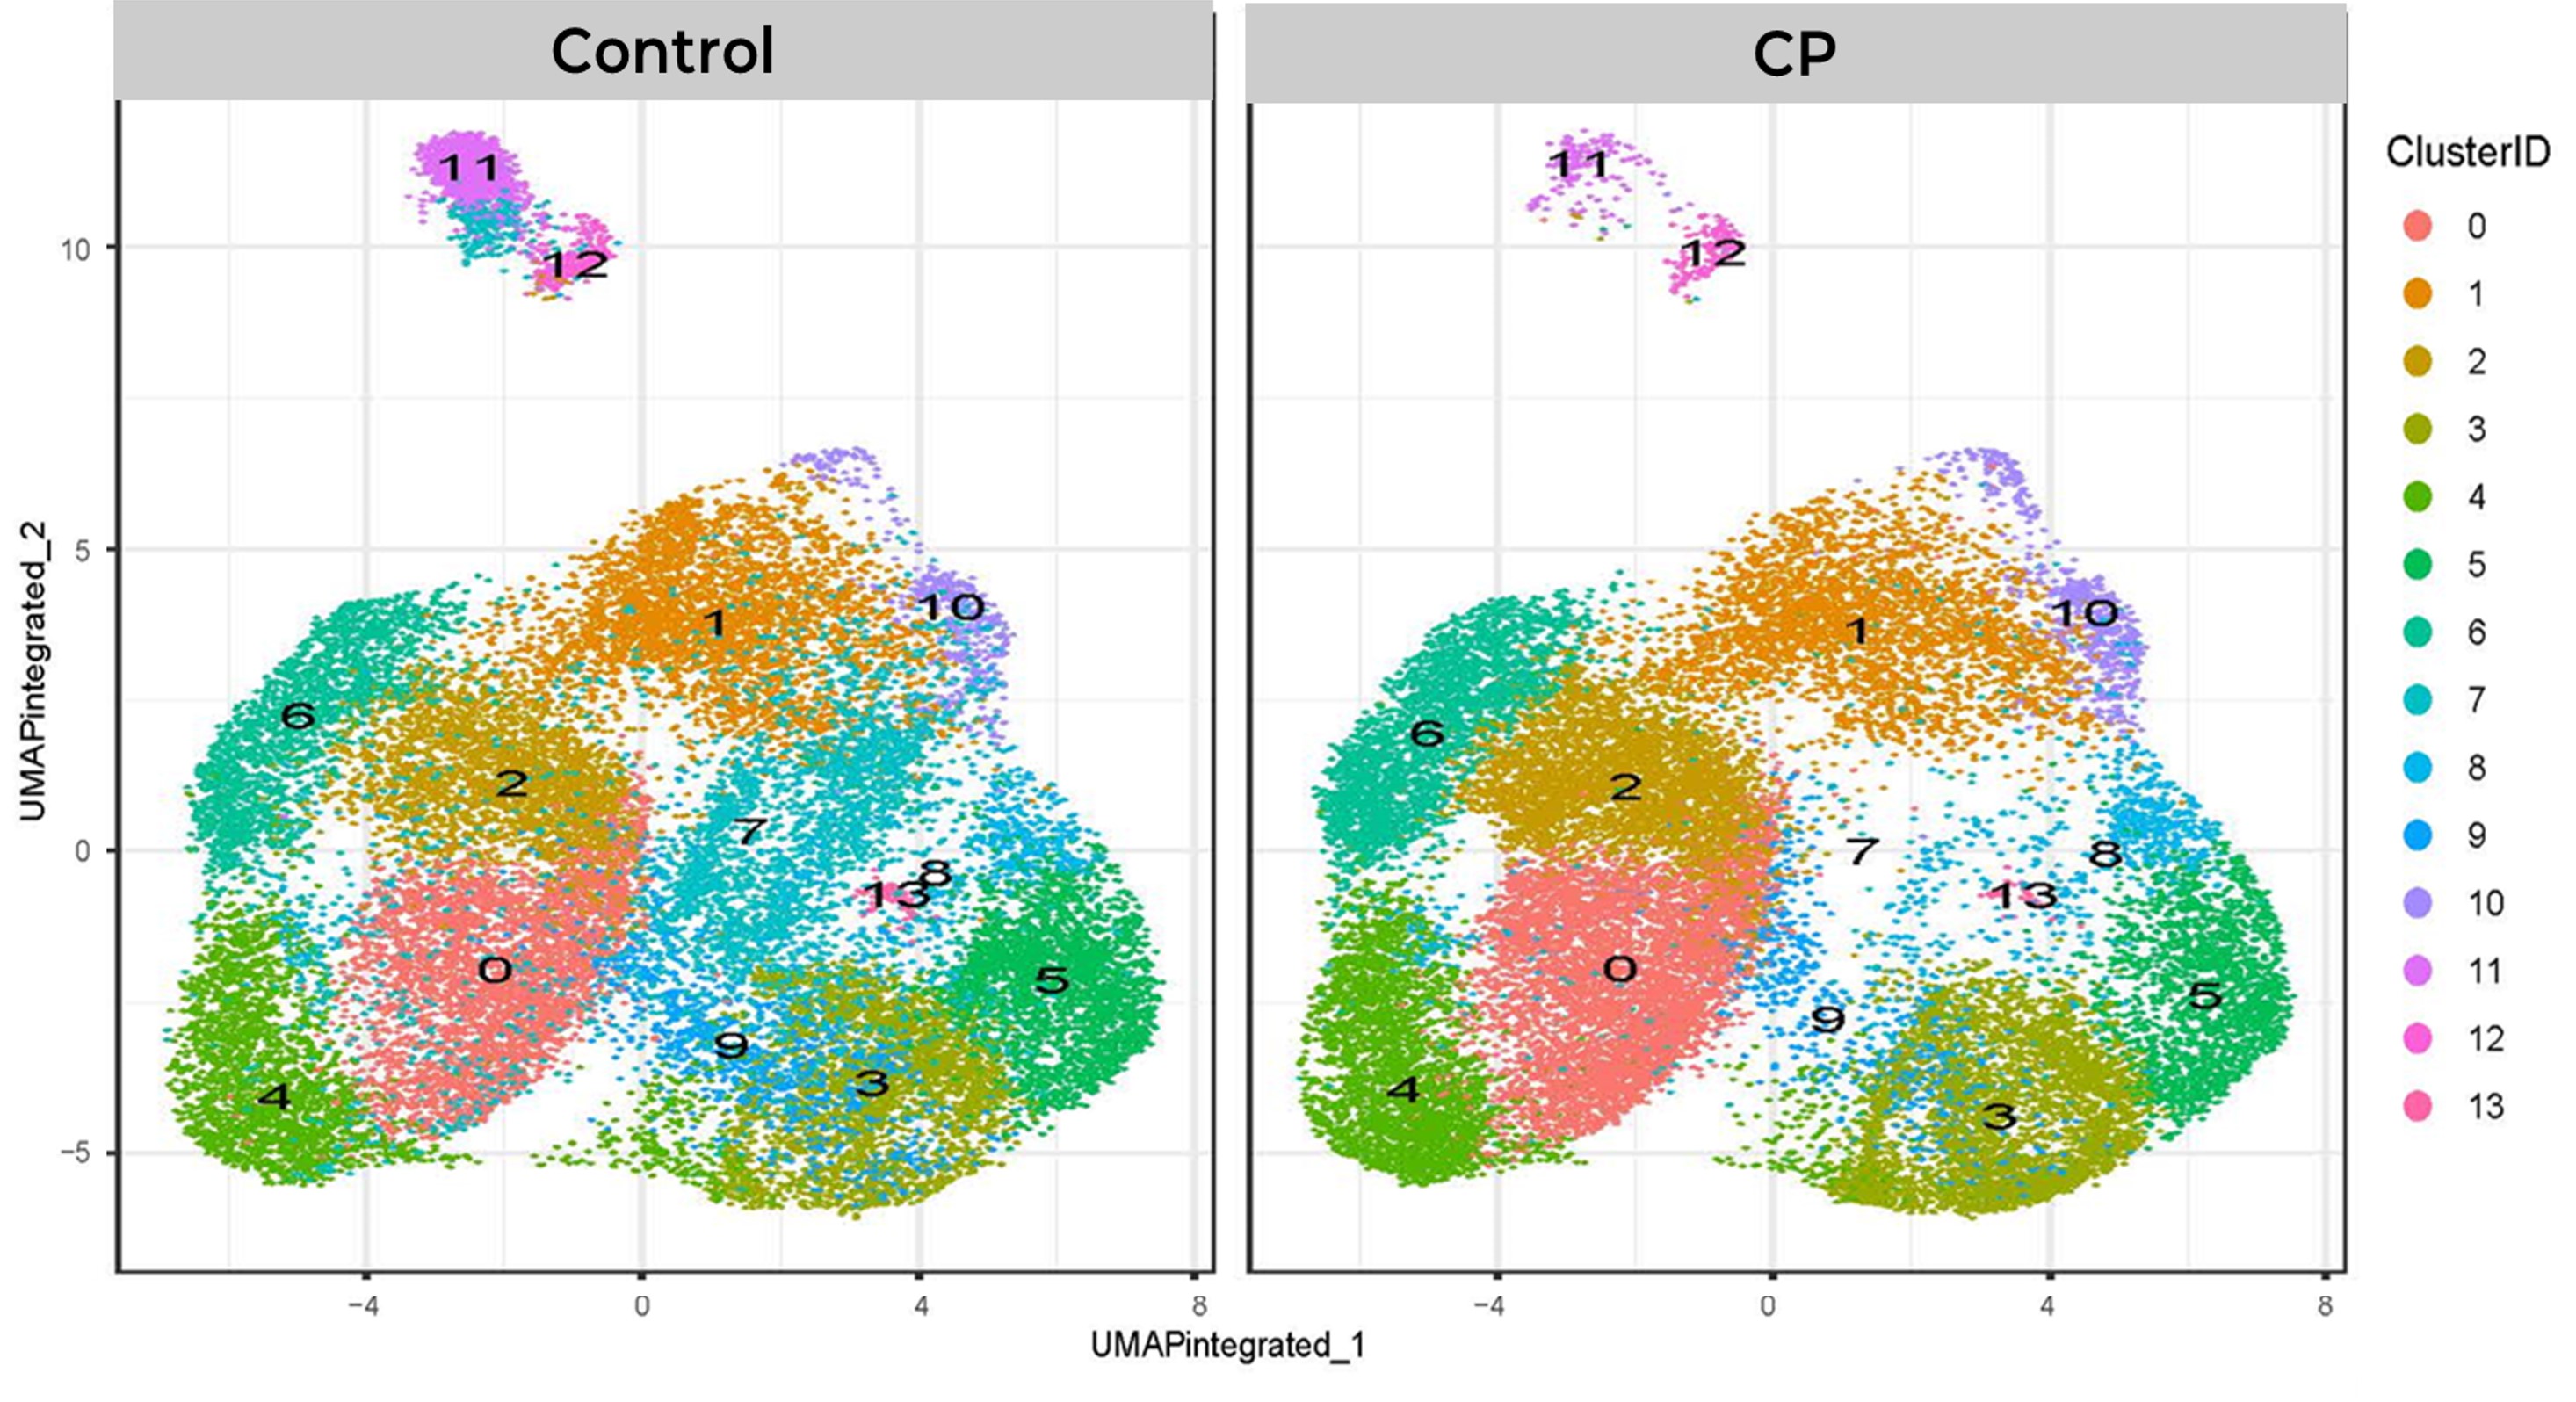 scRNA-seq was performed and UMAP non-linear dimensional reduction was used to place similar cells together in low-dimensional space. The control cohort (left) and CP cohort (right) displayed the same overall profile of SC-MB subpopulations with cells separating into 14 clusters; however, the CP cohort had far fewer cells in cluster 7.
 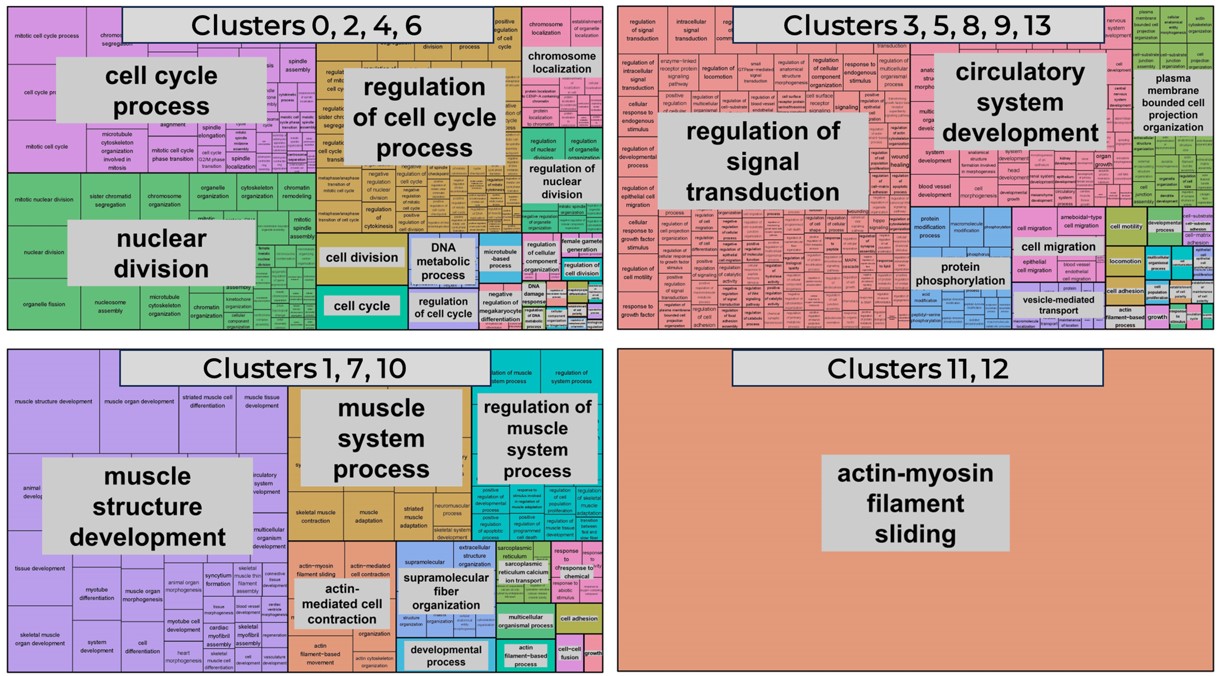 REVIGO treemaps of enriched biological processes are shown. Different colors represent families of related terms. The size of each rectangle reflects the p-value of the GO term. Clusters 0, 2, 4, and 6 (upper left) may represent cells in the M phase (4 and 6) and S phase (0 and 2) of the cell cycle. Clusters 3, 5, 8, 9, and 13 (upper right) may represent cells that are growing and migrating. Clusters 1, 7, and 10 (lower left) may represent cells that are beginning the process of muscle differentiation. Clusters 11 and 12 (lower right) may represent late-stage muscle differentiation.