
Genomics/Epigenomics
Session: Genomics/Epigenomics 1
 photo")
Ranga prasanth thiruvenkataramani, MD (he/him/his)
Assistant professor
Michigan State University College of Human Medicine
Lansing, Michigan, United States
.png) Hierarchical clustering analysis of mRNAs with altered gene expression between the two groups. Red strip, high relative expression; blue strip, low relative expression; white strip, no change in gene expression. Color intensity reflects the degree of expression (increase or decrease). Differentially expressed genes (DEG) with no significant difference in gene expression for MSCs mRNA from Gestational Diabetic vs normal MSCs. D: Isolated from placental WJ MSCs of Gestational Diabetes; W: Isolated from placental WJ MSCs of Normal Placenta.
Hierarchical clustering analysis of mRNAs with altered gene expression between the two groups. Red strip, high relative expression; blue strip, low relative expression; white strip, no change in gene expression. Color intensity reflects the degree of expression (increase or decrease). Differentially expressed genes (DEG) with no significant difference in gene expression for MSCs mRNA from Gestational Diabetic vs normal MSCs. D: Isolated from placental WJ MSCs of Gestational Diabetes; W: Isolated from placental WJ MSCs of Normal Placenta..png) Gene Ontology (GO) analysis showed up-regulated and down-regulated genes with no significant difference between normal and GDM MSCs.
Gene Ontology (GO) analysis showed up-regulated and down-regulated genes with no significant difference between normal and GDM MSCs.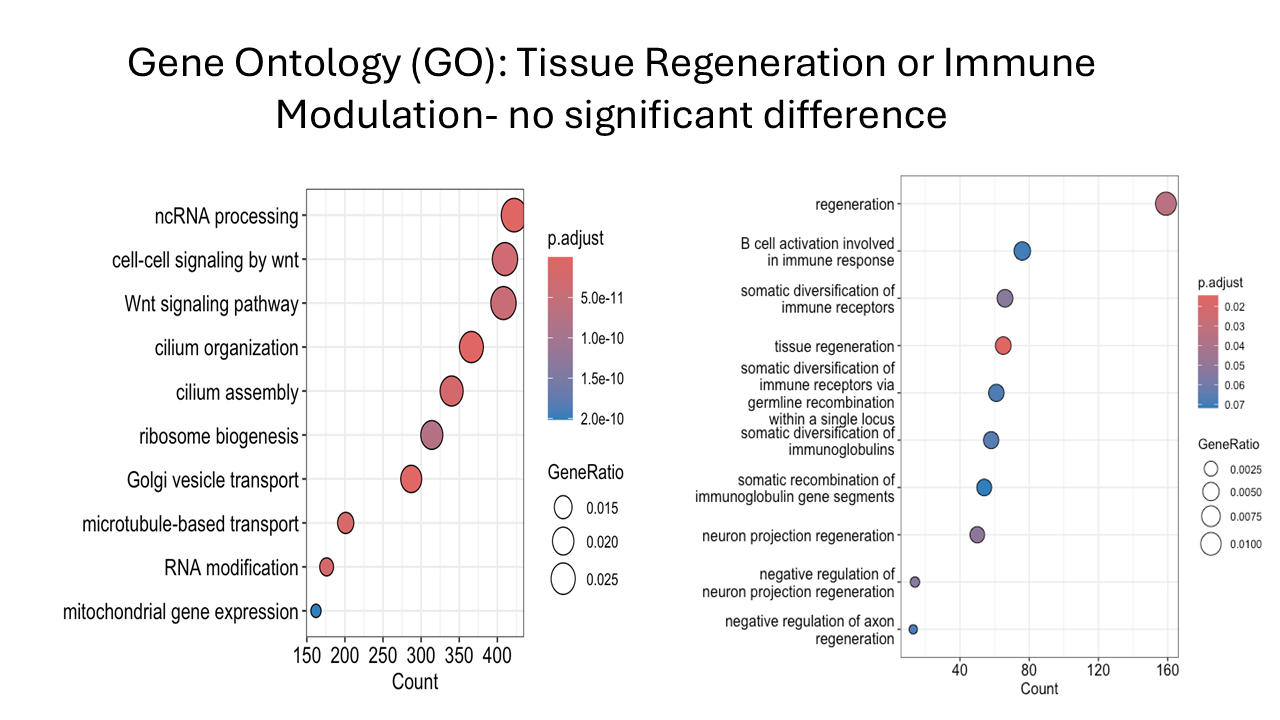 Gene Ontology (GO) analysis showed no difference between normal and GDM expression in genes for tissue regeneration and immune modulation.