
Neonatal Pulmonology
Session: Neonatal Pulmonology - Basic/Translational Science 1: Bronchopulmonary Dypslasia
 photo")
Carlotta Boggi, MSc (she/her/hers)
PhD student
University of Parma
Parma, Emilia-Romagna, Italy
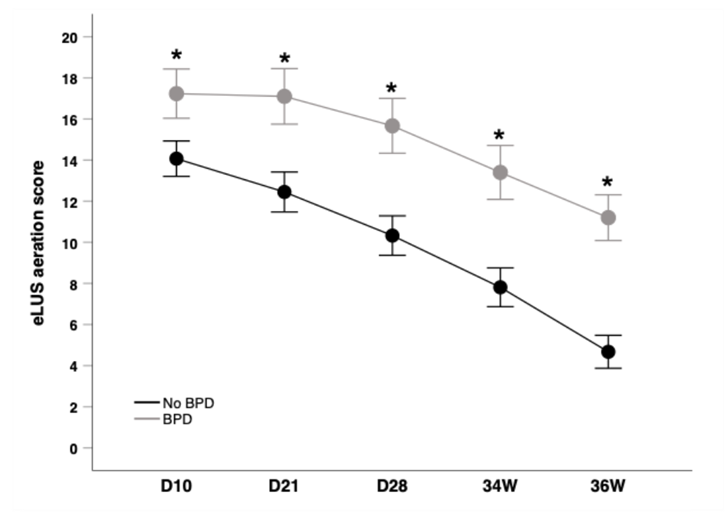 Grey and black circles indicate patients with and without BPD, respectively; T-bars indicate two standard errors. Post hoc, between-patients, head-to head significant comparisons were performed by Student test and indicated by the following symbols: *p < 0.001. Lung aeration was evaluated with the dimensionless extended lung ultrasound aeration score, calculated at 10, 21, 28 days of life and 34- and 36-weeks postconceptional age.
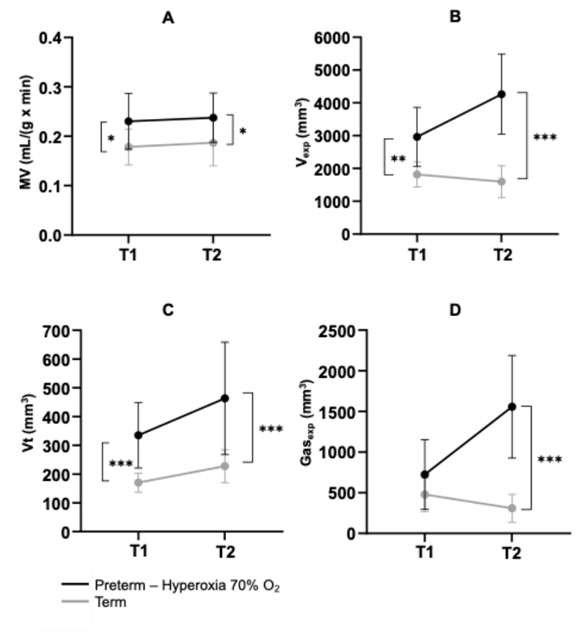 Minute Ventilation (MV), expiratory volume (Vexp), tidal volume (Vt) and the gas volume at end-expiration (Gasexp which represents functional residual capacity) are shown in Panel A, B, C and D, respectively. Grey and black circles indicate hyperoxia-exposed preterm rabbits and term control rabbits, respectively; T-bars indicate standard deviation. Statistical comparisons between the two experimental groups were performed using a two-way ANOVA, followed by Sidak's post-hoc test for multiple comparisons. Significant differences are indicated by vertical bars as follows: * p<0.05, ** p<0.01, *** p<0.001. T1-measurements are performed at 4 and 7 days of life for term and preterm rabbits, respectively; T2-measurements are performed at 11 and 14 days of life for term and preterm rabbits, respectively
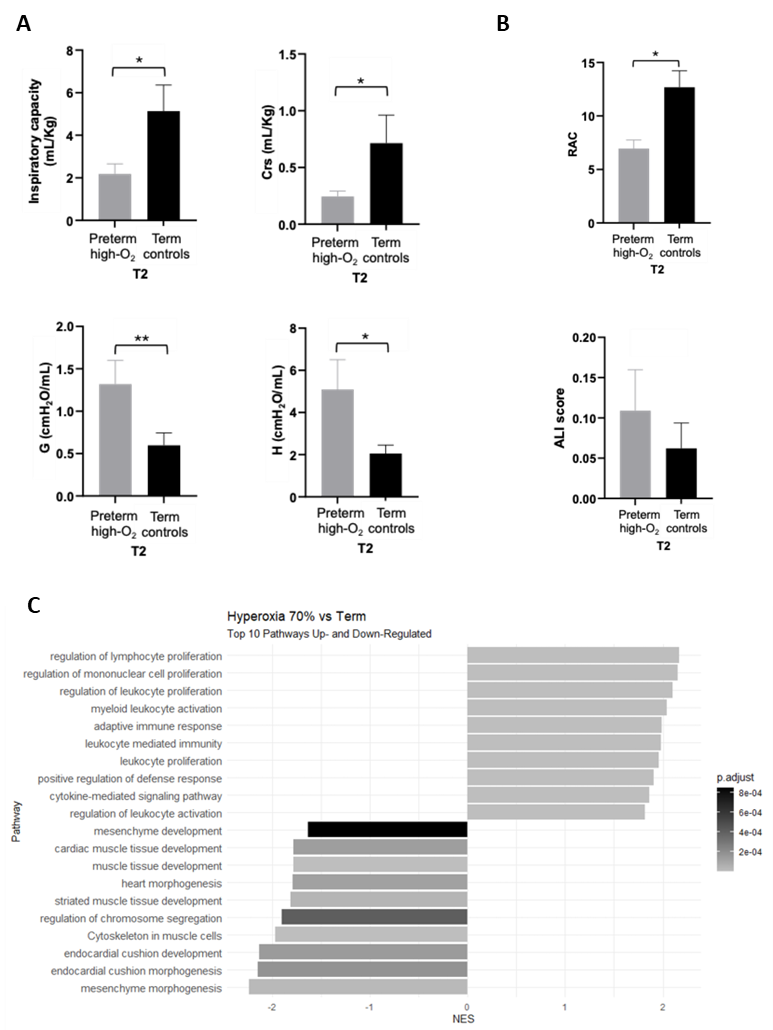 (A) Lung mechanics in the experimental rabbit model: parameters were measured with the FlexiVent. Inspiratory capacity, respiratory system compliance (Crs), tissue damping (G) and tissue elastance (H) are shown. Columns and T-bars represent mean and standard deviation, respectively. Black and grey columns represent term control rabbits and hyperoxia-exposed preterm rabbits, respectively; *p < 0.01, **p < 0.001 (Student test). (B) Radial alveolar count (RAC), and acute lung injury (ALI) score in preterm rabbits. Columns and T-bars represent mean and standard deviation, respectively; black and grey represent term control rabbits and hyperoxia-exposed preterm rabbits, respectively; *p < 0.0001 (Student test). (C) Pathway enrichment analysis performed with Gene Set Enrichment Analysis results comparing different conditions. The bar plots display the top 10 upregulated and downregulated pathways when comparing preterm-hyperoxic and normoxic rabbits. The normalized enrichment score (NES) is shown on the x-axis, indicating pathway activation or suppression; the scale gradient color indicates the adjusted p-value. Analyses were performed in R using GSEA.