
Critical Care
Session: Critical Care Trainee Ongoing Projects
 Credit")
 photo")
Danielle M. Severns, MD (she/her/hers)
Fellow Physician
Riley Hospital for Children at Indiana University Health
Indianapolis, Indiana, United States
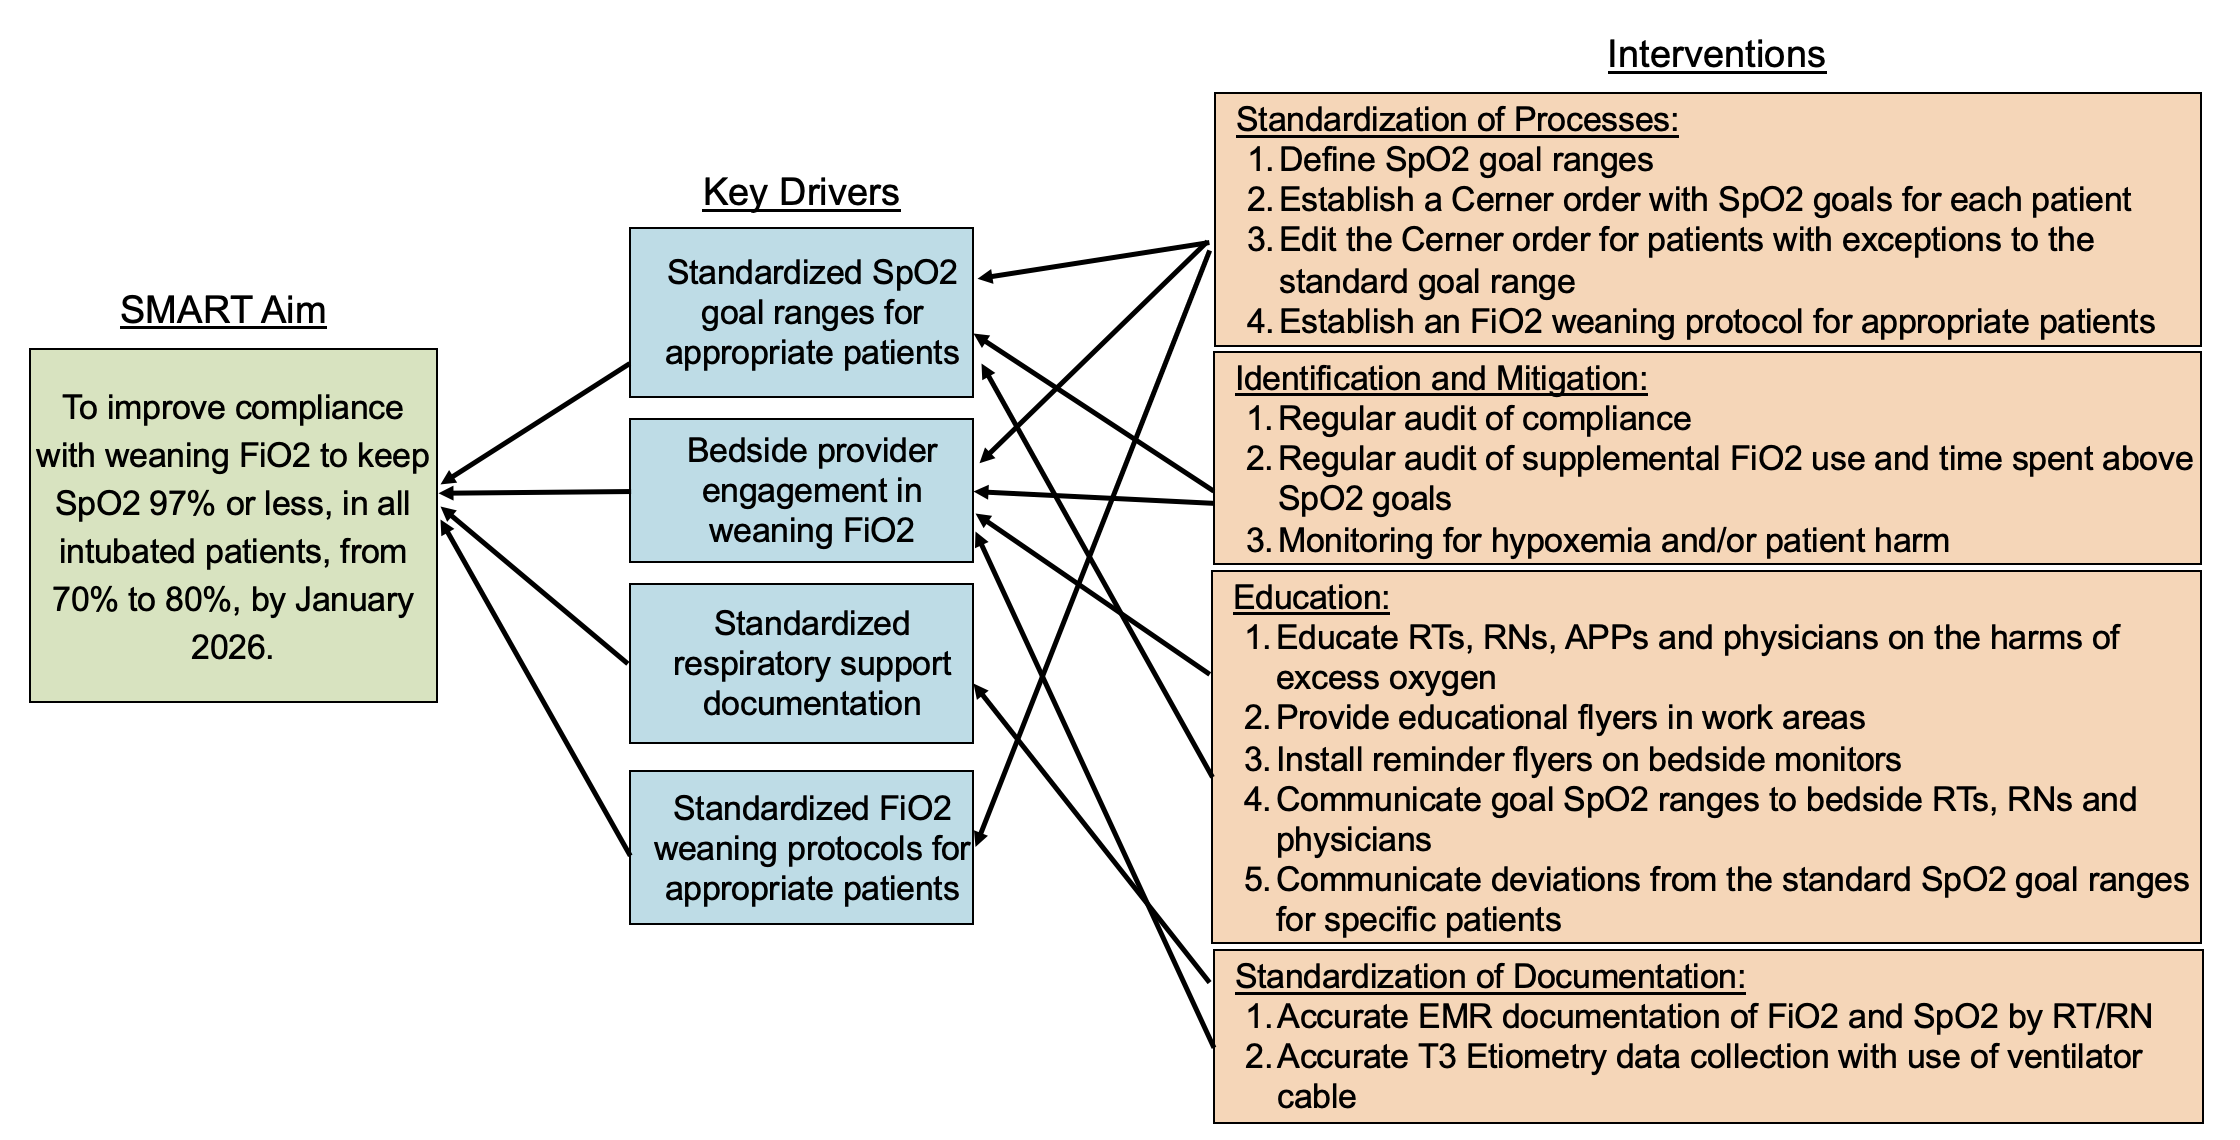 Our four key drivers include: standardized SpO2 goal ranges for patients, bedside provider engagement in weaning FiO2, standardized documentation of respiratory support and settings, and standardized FiO2 weaning protocols. A number of interventions have been completed or successfully implemented, but several are still ongoing.
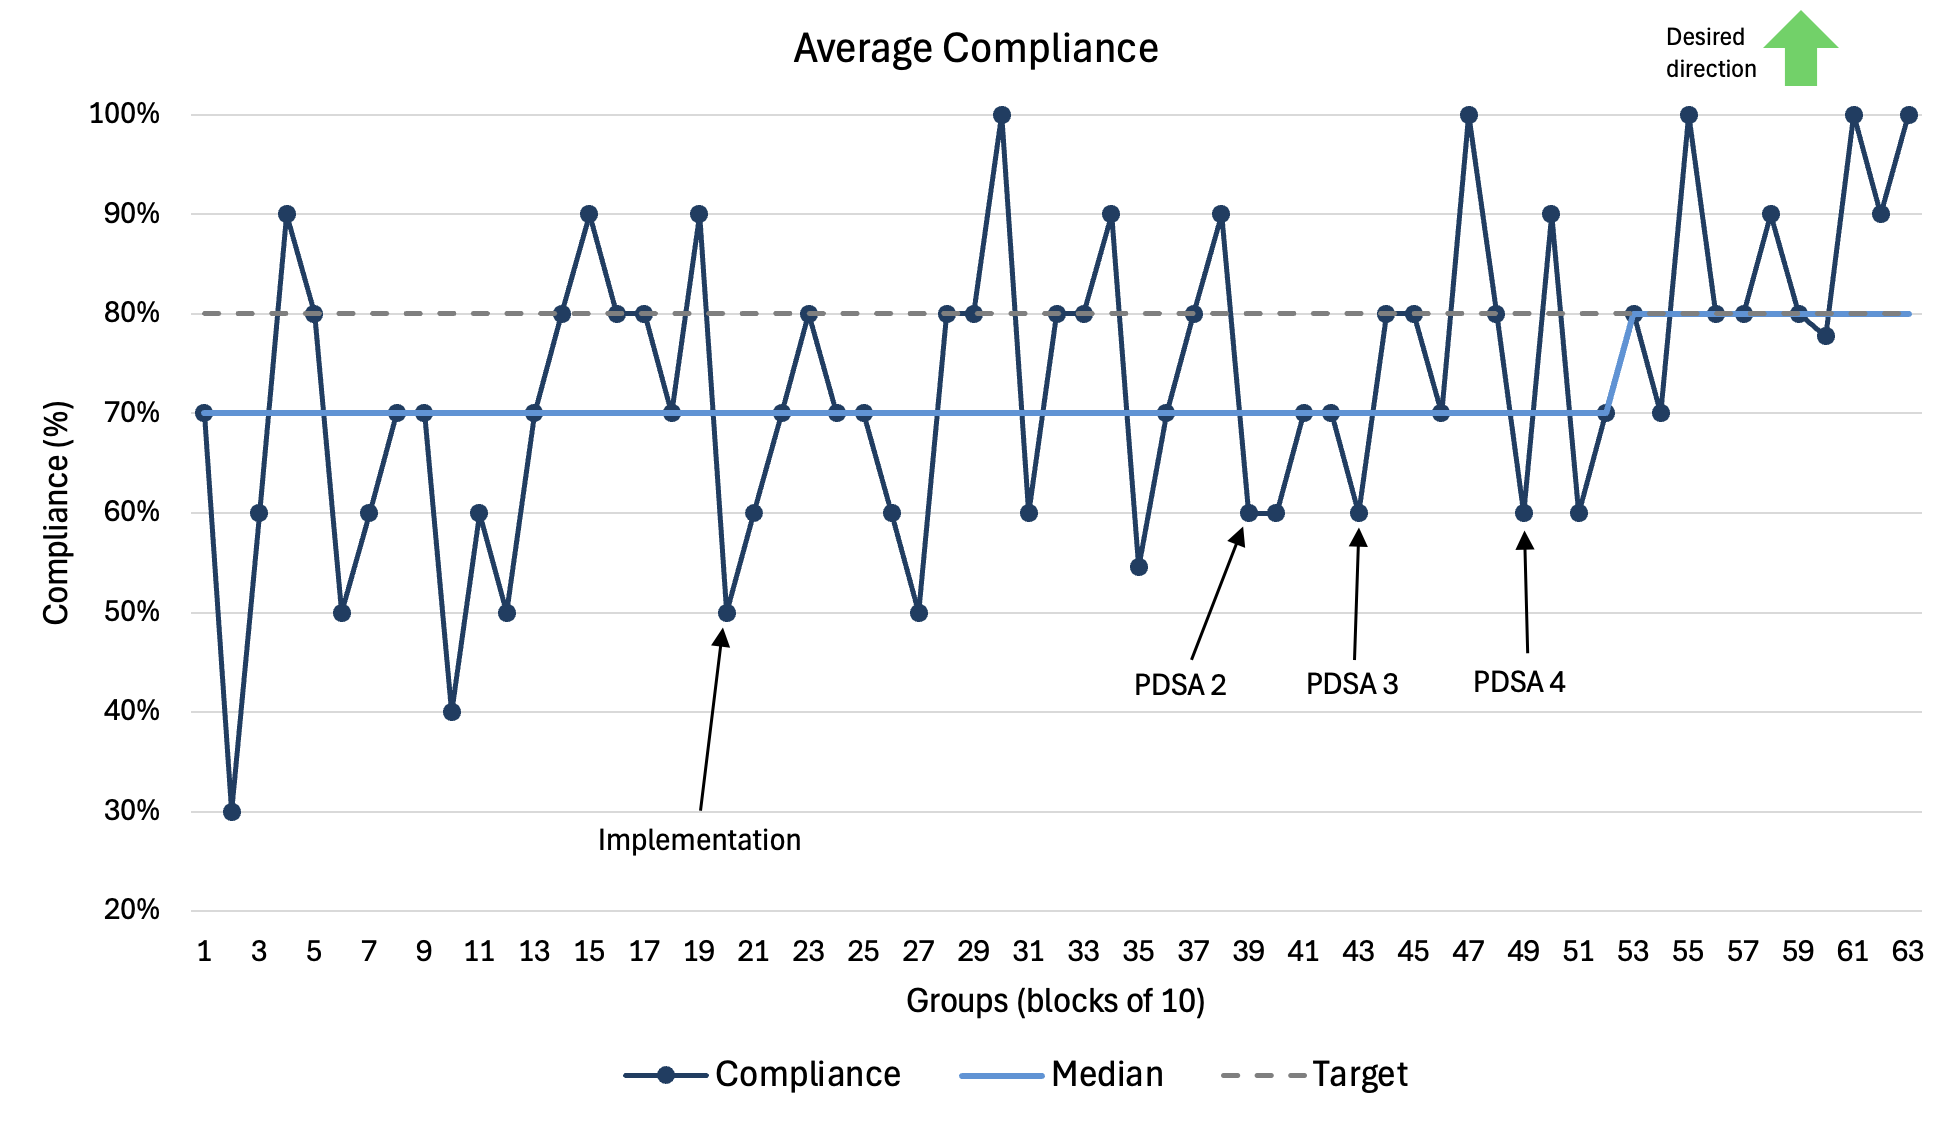 The x-axis is groups of patient data in blocks of 10, and each point on the graph is the average compliance of that group. The y-axis represents percentage of average compliance. The light blue horizontal line represents baseline median compliance rate starting at 70%, and the gray dotted line represents goal median compliance rate of 80%. The arrow labels correspond to the timing of each PDSA cycle. There has been an upward trend in the desired direction of change, and beginning with block 53 there is a significant increase in the median to goal median compliance.
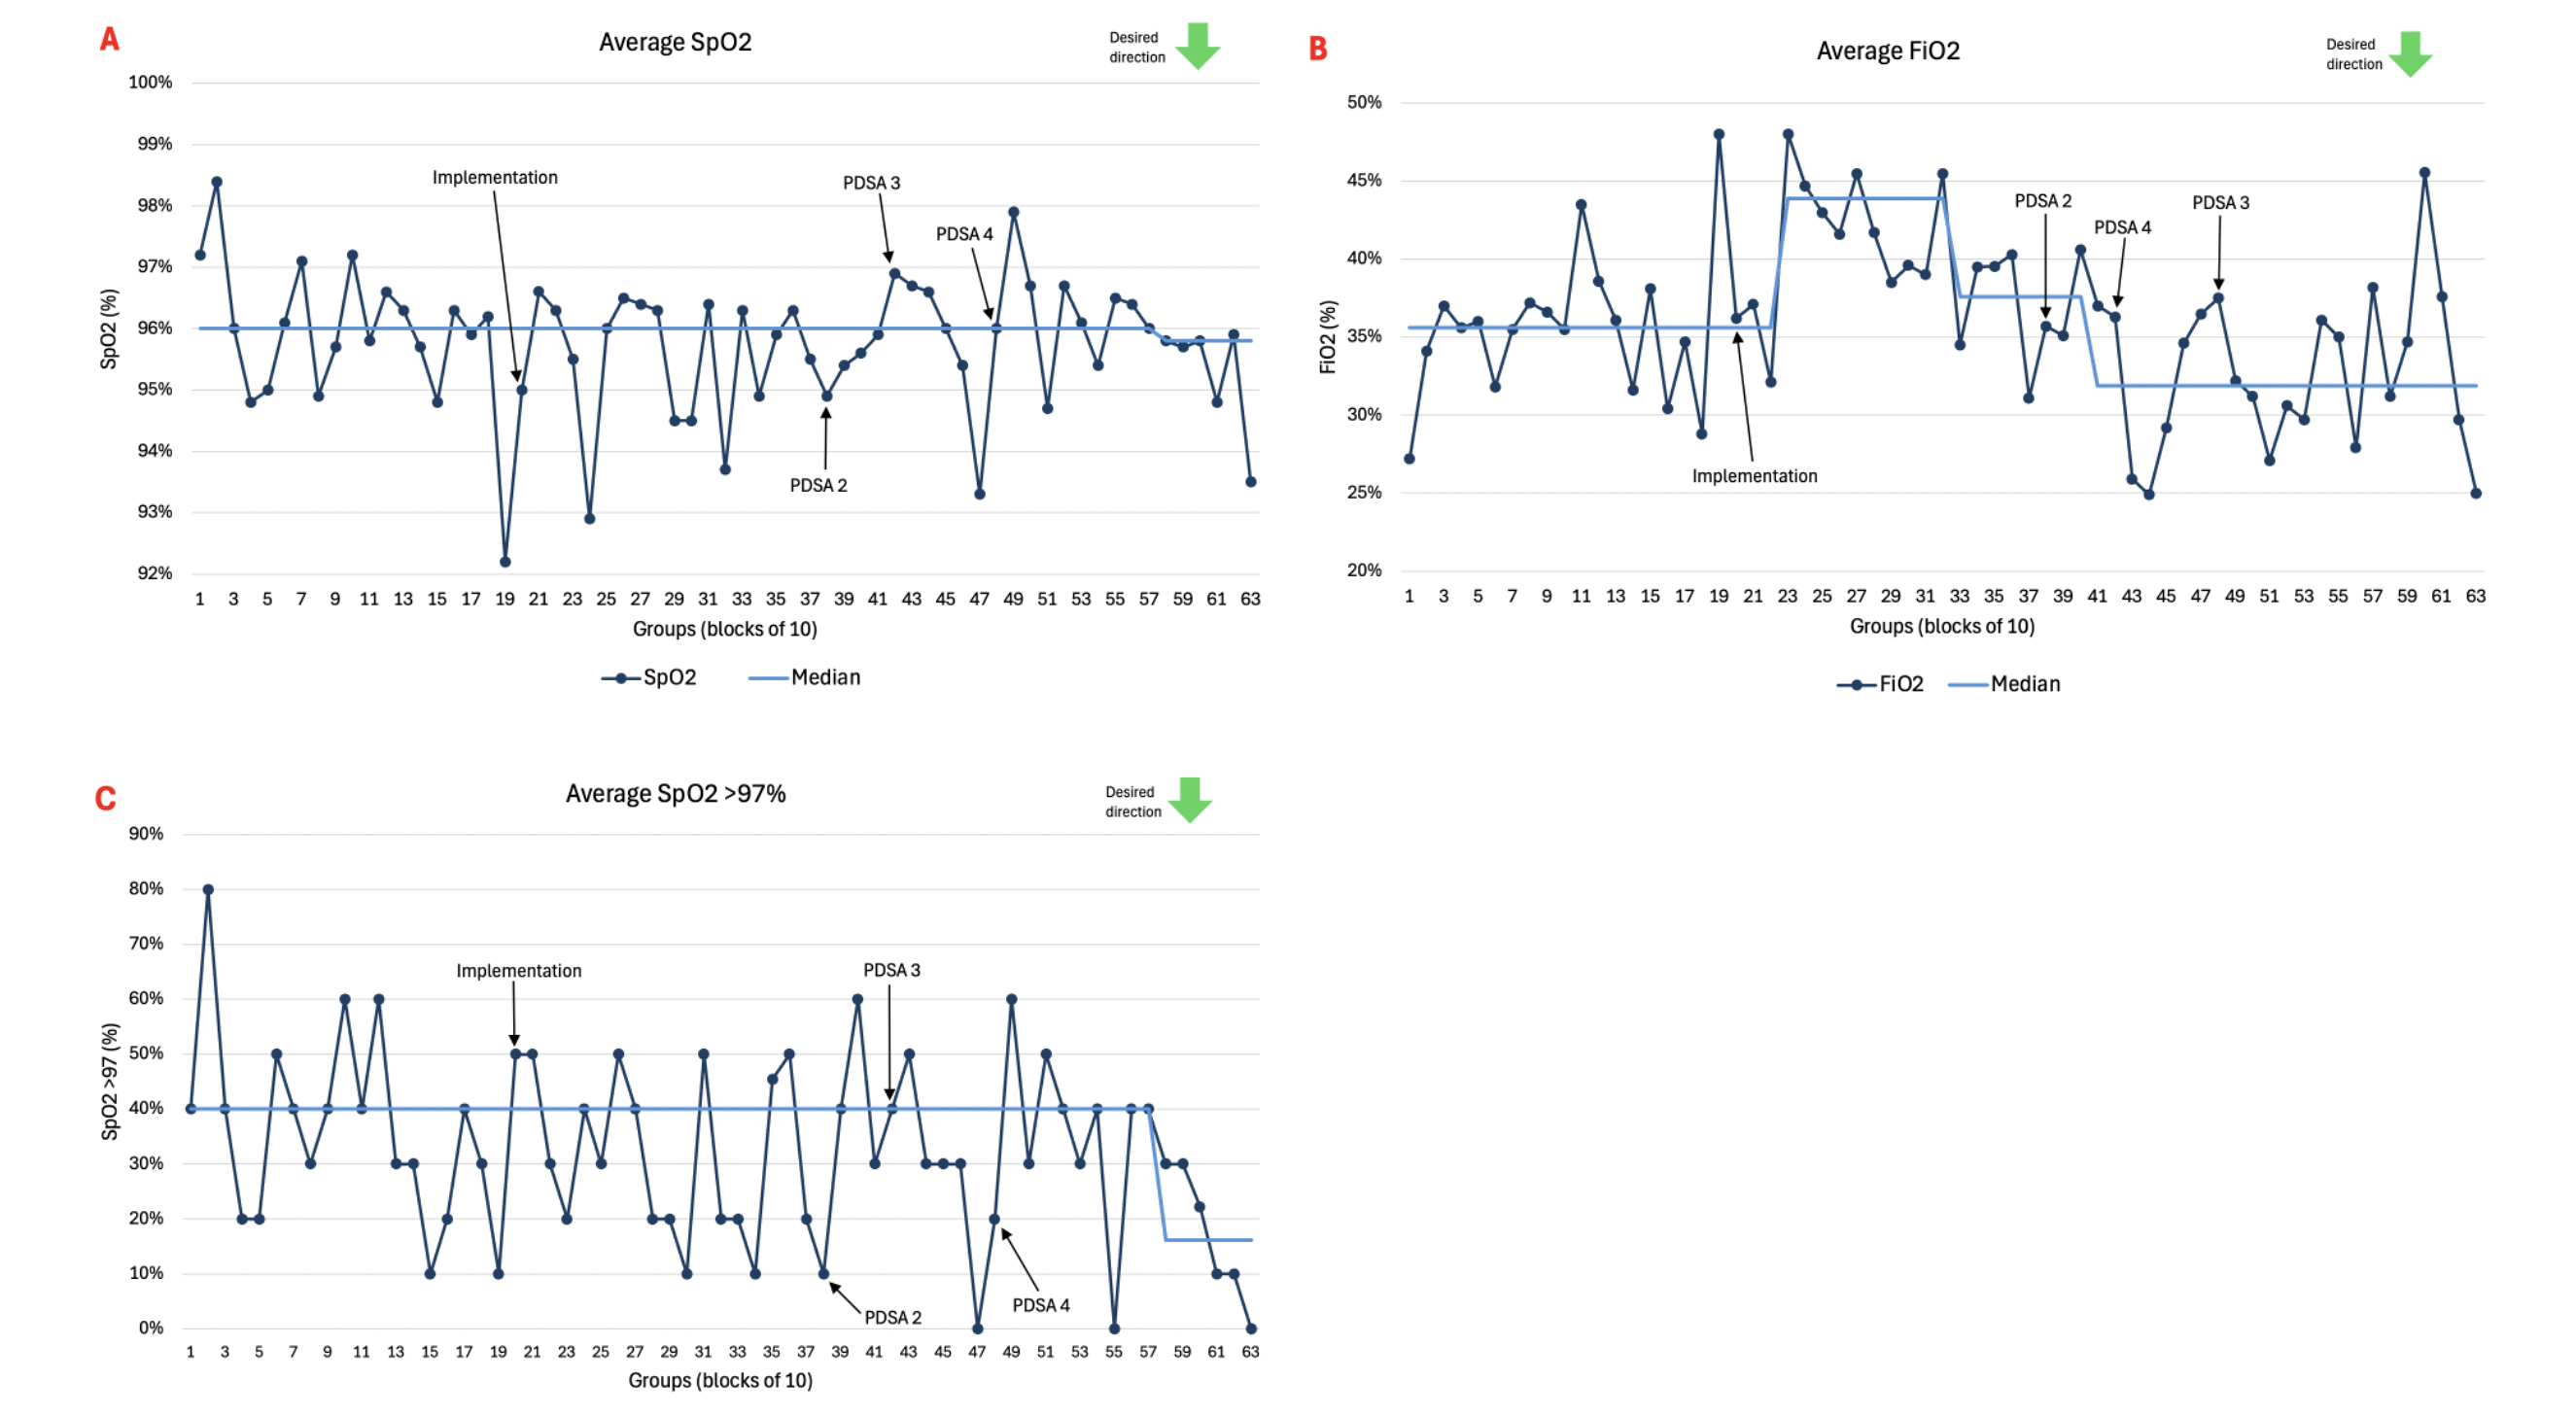 Groups of patient data are represented in blocks of 10 on the x-axis, and each point on the graph is the average value of that group. The y-axis represents percentage of average SpO2 (3A), FiO2 (3B), and SpO2 > 97% (3C), respectively. Each run chart has demonstrated improvement in the median in the desired direction of change.