
Health Equity/Social Determinants of Health
Session: Health Equity/Social Determinants of Health 2
 photo")
Joseph D. Suh, BS (he/him/his)
Postbaccalaureate Researcher
Washington University in St. Louis School of Medicine
St. Louis, Missouri, United States
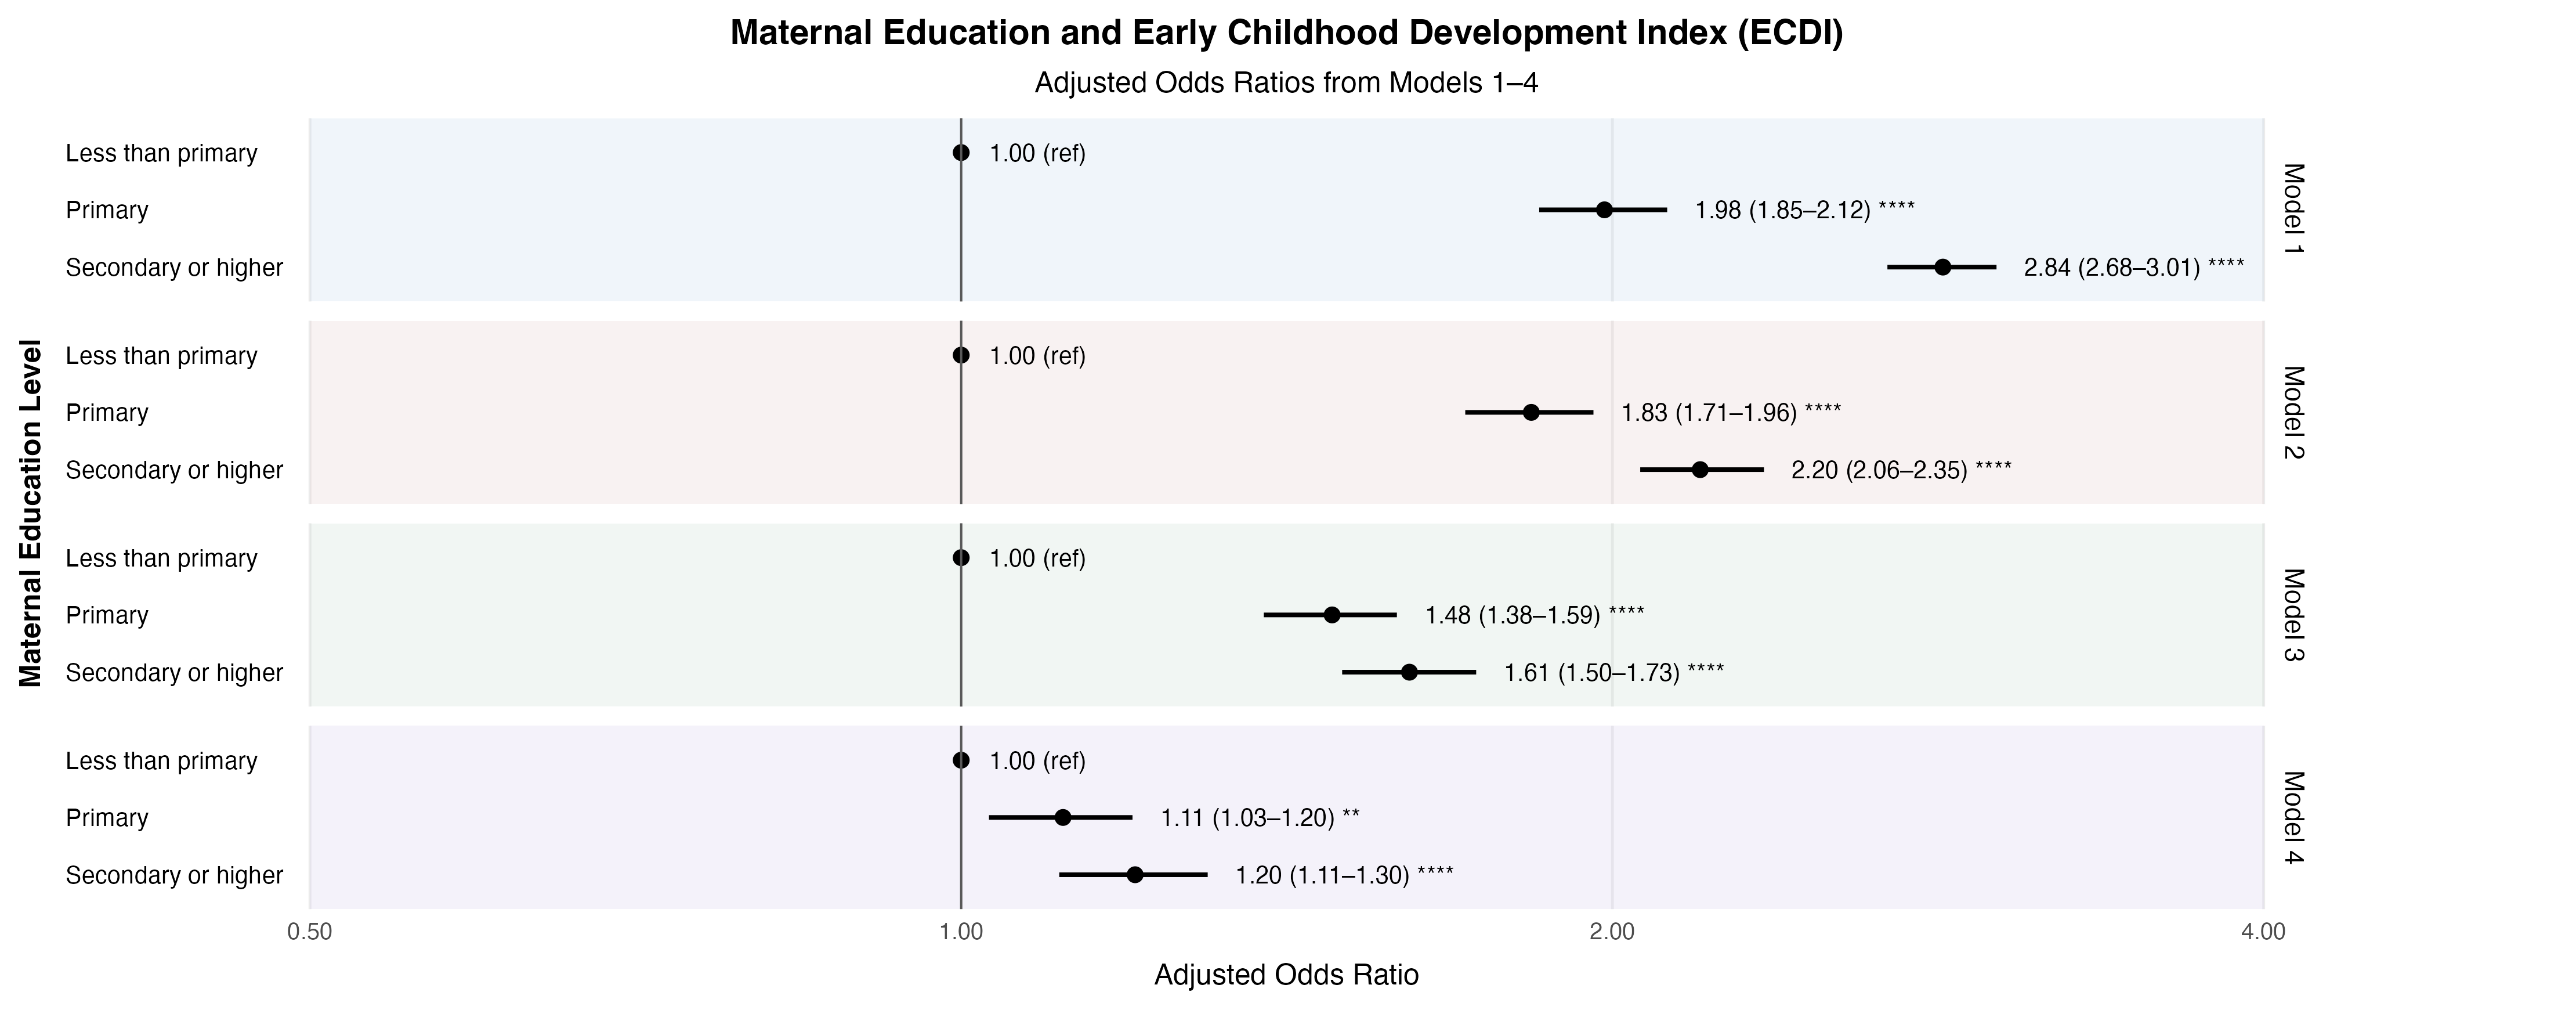 Forest plot of adjusted odds ratios (aOR) and 95% CIs for meeting ECDI standards among children aged 3-4 years by model. Model 1 adjusts for the child covariates age, sex, wasting, stunting, overweight, underweight, and child disability. Model 2 additionally adjusts for the maternal covariates maternal age and Women's Empowerment Index. Model 3 additionally adjusts for the household covariates wealth index, household size, improved water source, improved sanitation, child stimulation, early childhood program attendance, and paternal education. Model 4 additionally adjusts for the contextual covariates region, urban status, country, and year. Maternal education levels secondary or higher and primary are compared to less than primary. Estimates are displayed on a log10 scale. Asterisks denote significance (p < 0.05 = *, <0.01 = **, <0.001 = ***, <0.0001 = ****).
.png) Forest plot of adjusted odds ratios (aOR) and 95% CIs for meeting foundational literacy and numeracy standards among children aged 7-14 years by model. Model 1 adjusts for the child covariates age, sex, and child disability. Model 2 additionally adjusts for the maternal covariates maternal age and Women's Empowerment Index. Model 3 additionally adjusts for the household covariates wealth index, household size, improved water source, improved sanitation, parental involvement, and paternal education. Model 4 additionally adjusts for the contextual covariates region, urban status, country, and year. Maternal education levels secondary or higher and primary are compared to less than primary. Estimates are displayed on a log10 scale. Asterisks denote significance (p < 0.05 = *, <0.01 = **, <0.001 = ***, <0.0001 = ****).
Forest plot of adjusted odds ratios (aOR) and 95% CIs for meeting foundational literacy and numeracy standards among children aged 7-14 years by model. Model 1 adjusts for the child covariates age, sex, and child disability. Model 2 additionally adjusts for the maternal covariates maternal age and Women's Empowerment Index. Model 3 additionally adjusts for the household covariates wealth index, household size, improved water source, improved sanitation, parental involvement, and paternal education. Model 4 additionally adjusts for the contextual covariates region, urban status, country, and year. Maternal education levels secondary or higher and primary are compared to less than primary. Estimates are displayed on a log10 scale. Asterisks denote significance (p < 0.05 = *, <0.01 = **, <0.001 = ***, <0.0001 = ****)..png) Forest plot of age, sex, or urban status stratum-specific adjusted odds ratios (aOR) and 95% CIs for meeting ECDI standards among children aged 3-4 years. Columns display comparisons between maternal education levels. Rows group levels of each effect modifier. Estimates come from models fully adjusted for all child, maternal, household, and contextual covariates and include an interaction between maternal education and the effect modifier. Maternal education levels secondary or higher and primary are compared to less than primary within every stratum. Estimates are displayed on a log10 scale. Asterisks denote significance (p < 0.05 = *, <0.01 = **, <0.001 = ***, <0.0001 = ****).
Forest plot of age, sex, or urban status stratum-specific adjusted odds ratios (aOR) and 95% CIs for meeting ECDI standards among children aged 3-4 years. Columns display comparisons between maternal education levels. Rows group levels of each effect modifier. Estimates come from models fully adjusted for all child, maternal, household, and contextual covariates and include an interaction between maternal education and the effect modifier. Maternal education levels secondary or higher and primary are compared to less than primary within every stratum. Estimates are displayed on a log10 scale. Asterisks denote significance (p < 0.05 = *, <0.01 = **, <0.001 = ***, <0.0001 = ****).