
Neonatal-Perinatal Health Care Delivery
Session: Neo-Perinatal Health Care Delivery: Practices and Procedures 3
 photo")
Megha Sharma, MD MS (she/her/hers)
Associate Professor, Neonatology
University of Arkansas for Medical Sciences
Little Rock, Arkansas, United States
.png)
.png) This plot depicts colorimetric measures reported by Spectrophotometer, SkinColorCatch, over serial weekly measurements on the Y-axis, with chronological age in days on the X-axis. Each dot represents a value of the colorimetric measure for a neonate. The solid line shows the marginal prediction of the colorimetric measure from mixed-effects linear regression model, the shaded areas represent the 95% confidence intervals. Melanin Index and Erythema index are both reported on an arbitrary scale of 0-999, Individual Typology angle (ITA) is reported on a scale of -90° to +90°, L is reported on a scale of 0 (Black) to 100 (White).
This plot depicts colorimetric measures reported by Spectrophotometer, SkinColorCatch, over serial weekly measurements on the Y-axis, with chronological age in days on the X-axis. Each dot represents a value of the colorimetric measure for a neonate. The solid line shows the marginal prediction of the colorimetric measure from mixed-effects linear regression model, the shaded areas represent the 95% confidence intervals. Melanin Index and Erythema index are both reported on an arbitrary scale of 0-999, Individual Typology angle (ITA) is reported on a scale of -90° to +90°, L is reported on a scale of 0 (Black) to 100 (White). 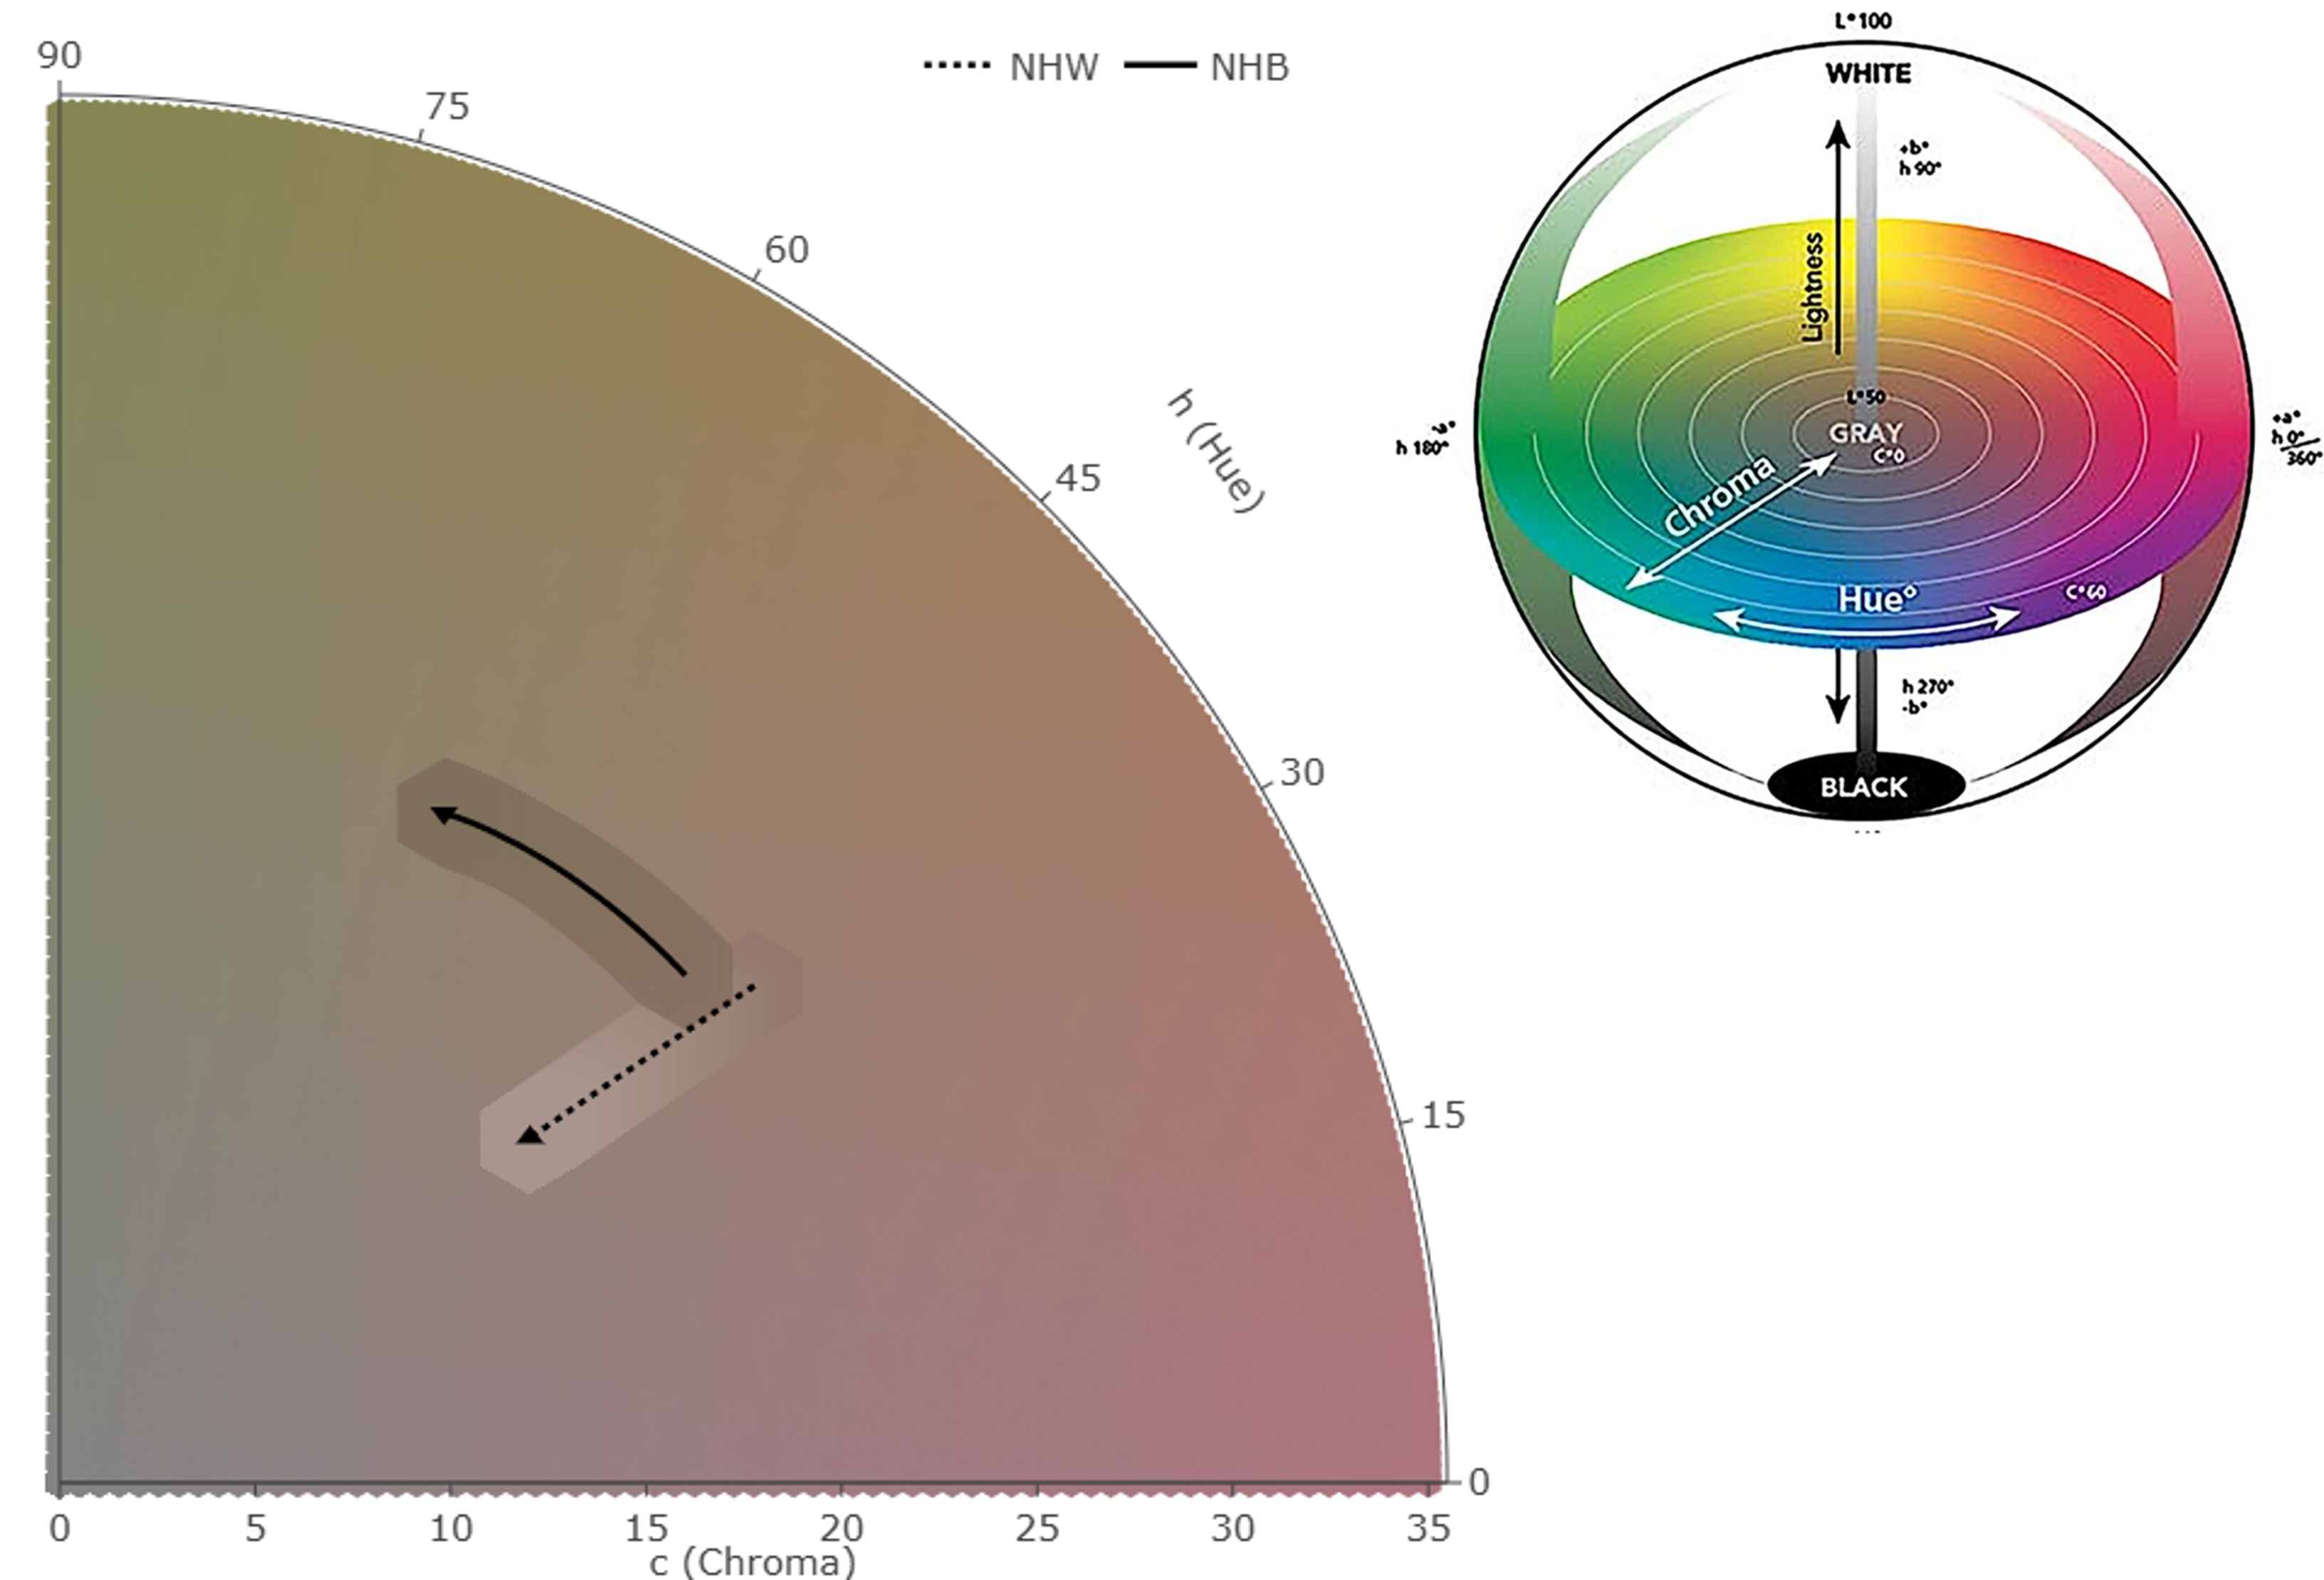 Visual representation of skin pigmentation for NHB (solid arrow) and NHW (dotted arrow) infants. This plot reproduces skin color in a 3-D space using colorimetric coordinates obtained from the spectrophotometer which captures a color's brightness (lightness, L), intensity or vividness (chroma, c) and the actual color eg, red, green, blue (hue, h). In the quadrant below, the hue (h) and chroma (c) are displayed in 2-D space as angle 0-90° and radius (0-35) respectively. Length of arrow from head to tail represents chronological age (0-180 days). The band around the two arrows captures the lightness L in addition to the h and c coordinates for the NHB and NHW groups. [the figure on the right depicts Lch color space diagram; Figure without copyright]