
Neonatal Neurology
Session: Neonatal Neurology 3: Clinical - Term 3
 photo")
Olivia C. Brandon, BS (she/her/hers)
Medical Student
University of Washington School of Medicine
Seattle, Washington, United States
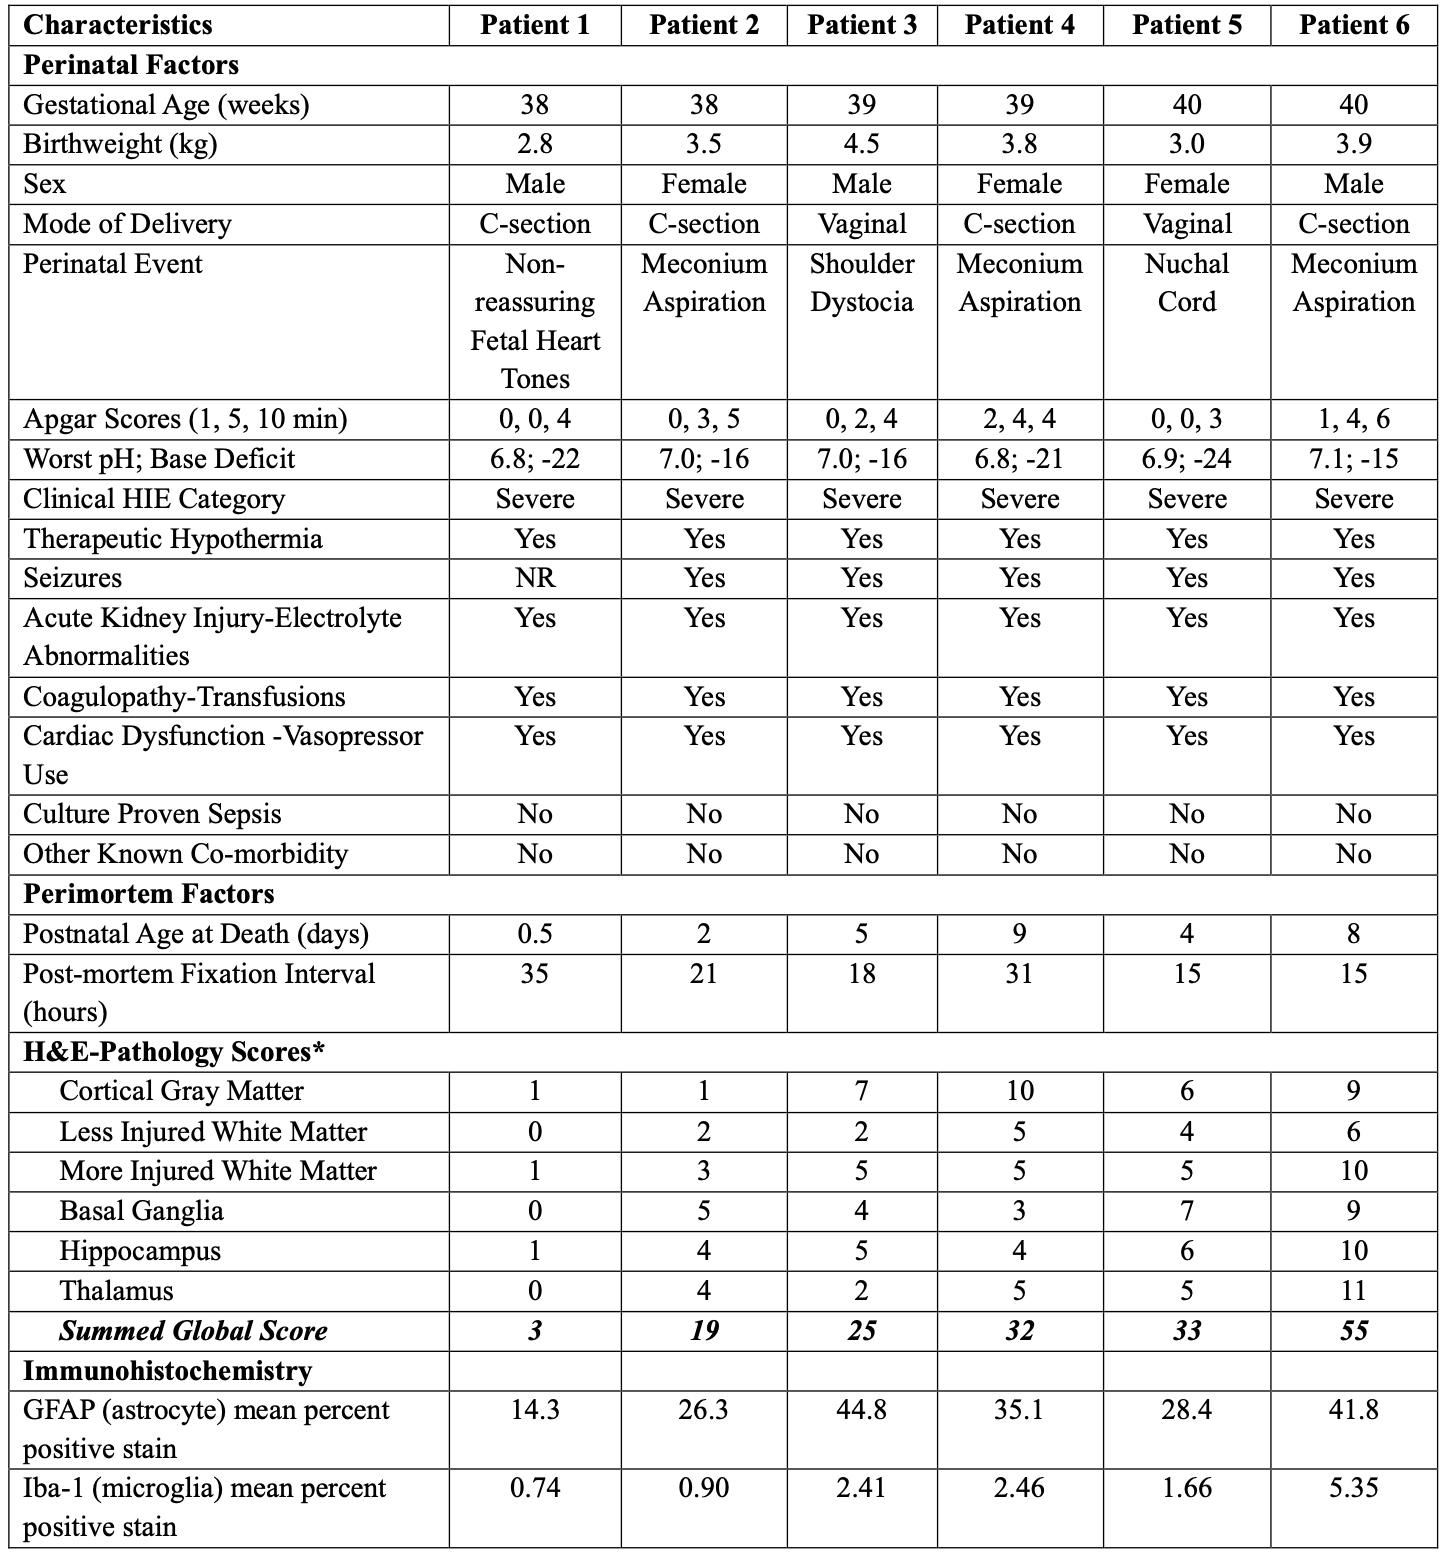 NR, not recorded (no electroencephalography); H&E, hematoxylin-and-eosin
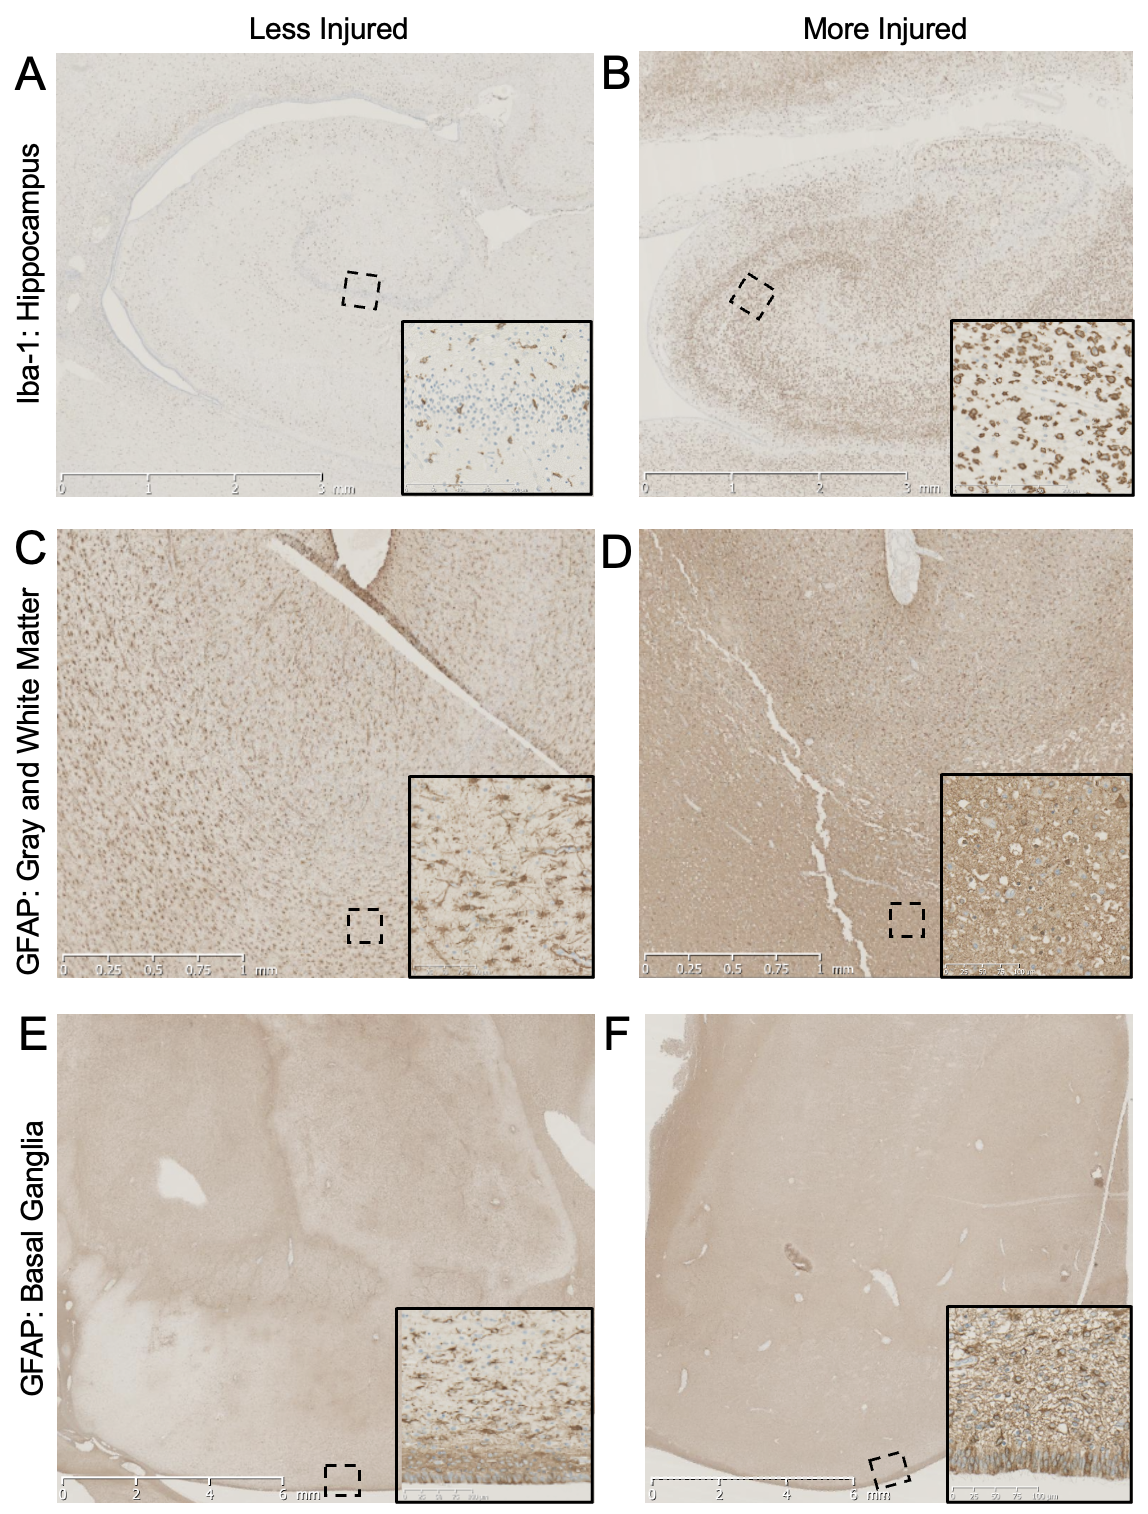 Hippocampus (A, B; top row), gray and white matter (C, D; middle row), and basal ganglia (E, F; bottom row) shown. The hippocampus is stained with Iba-1 to highlight microglia, while gray and white matter and basal ganglia are stained with GFAP to highlight astrocytes. The number and size of microglial cells and the density of GFAP-immunoreactive astrocytes are markedly increased in areas with more severe hematoxylin-and-eosin (H&E) findings. Insets (20X magnification) show the boxed regions: dentate gyrus of the hippocampus, subcortical white matter beneath a sulcus, and caudate nucleus of the basal ganglia. Less severe examples are from Patient 2 (global pathology score: 19) and the more severe examples are from Patient 6 (global pathology score: 55).
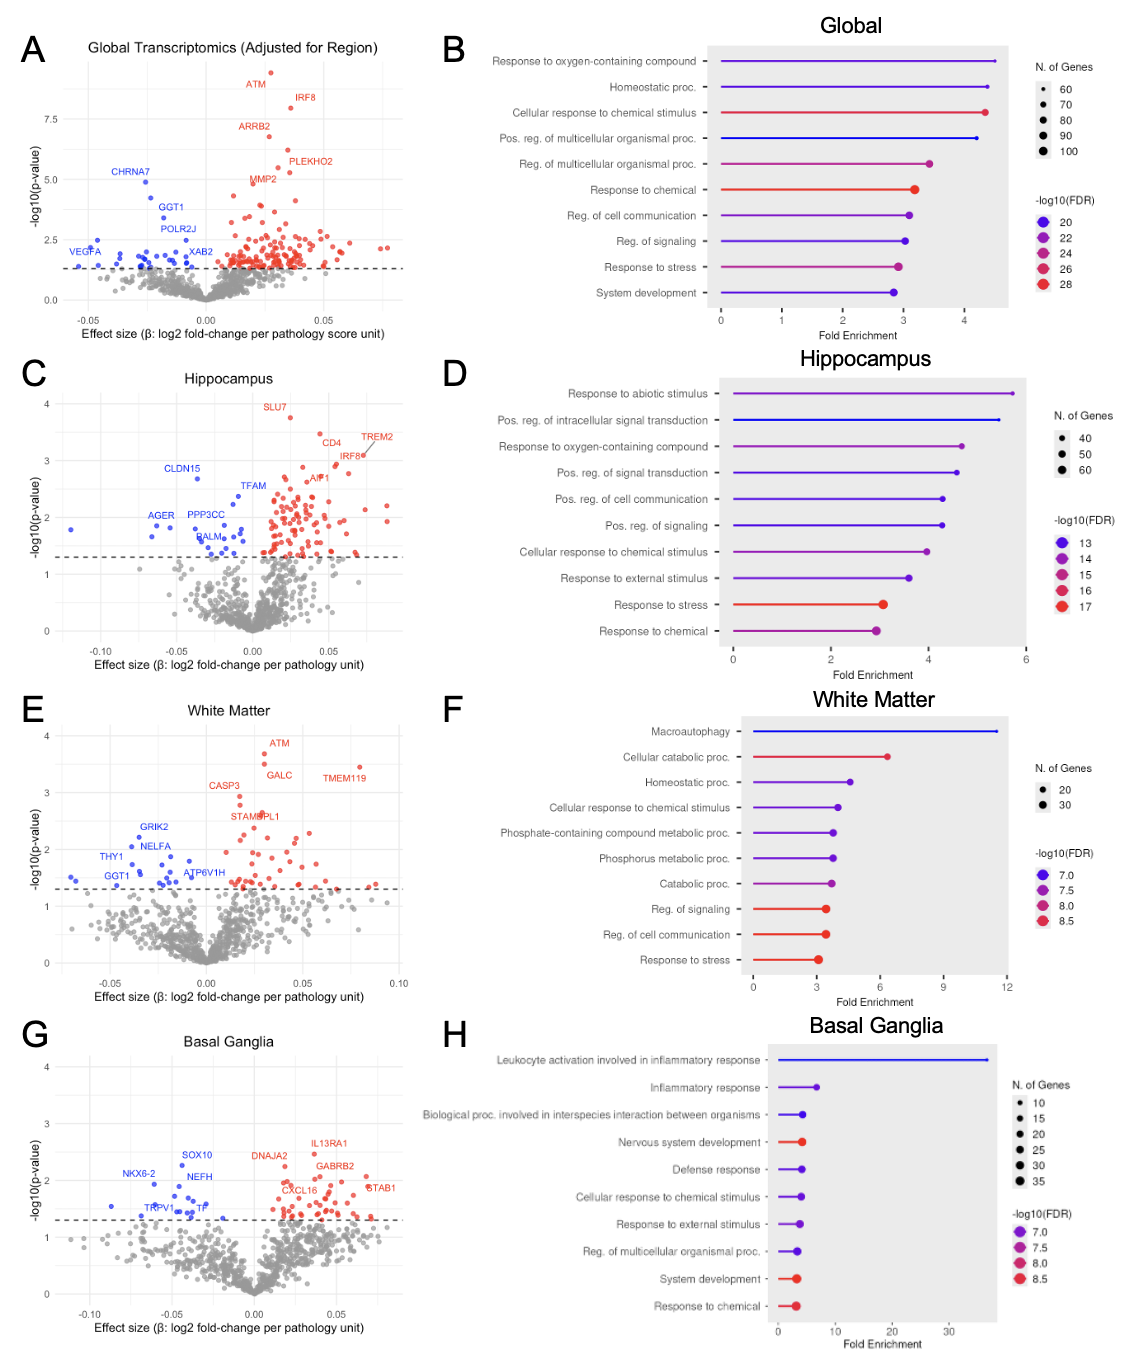 Volcano plots showing the relationship between effect size (β: log₂ fold-change per unit increase in pathology score) and statistical significance (−log₁₀ p-value) for all transcripts analyzed globally (A), in the hippocampus (C), white matter (E), and basal ganglia (G). The global model included adjustment for region. Each point represents an individual transcript; red points indicate transcripts significantly upregulated, and blue points indicate those significantly downregulated with increasing pathology severity. The horizontal dashed line marks the significance threshold (p=0.05). The top five most significantly upregulated and downregulated transcripts are labeled. ShinyGo was used to visualize the biological pathways related to the significantly expressed transcripts globally (B), in the hippocampus (D), white matter (F), and basal ganglia (H).