
Neonatal Pulmonology
Session: Neonatal Pulmonology - Basic/Translational Science 1: Bronchopulmonary Dypslasia
 photo")
Carlotta Boggi, MSc (she/her/hers)
PhD student
University of Parma
Parma, Emilia-Romagna, Italy
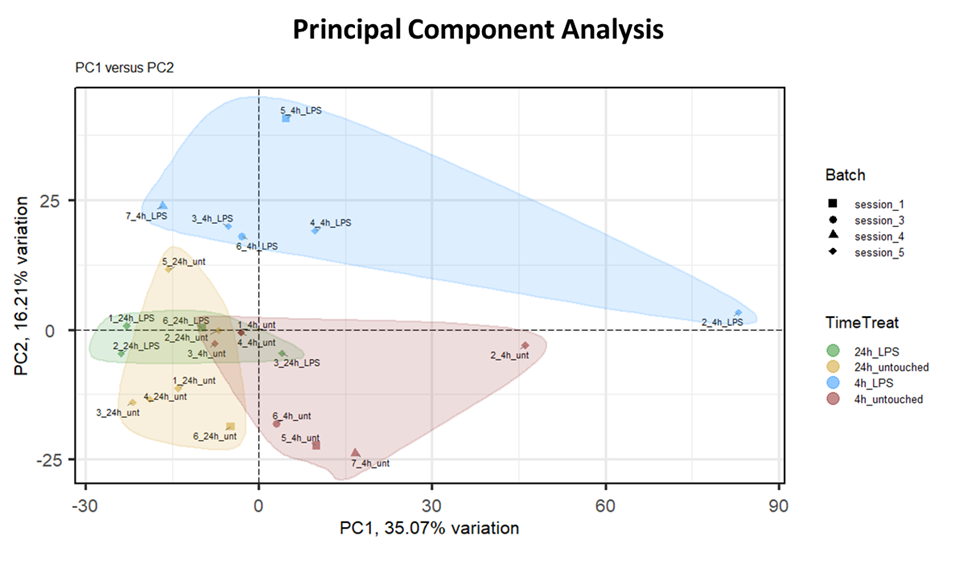 The analysis was performed after removing batch effects. Each point represents one biological replicate, and colors indicate treatment and time conditions. Samples cluster according to treatment and exposure time, showing clear separation between LPS-exposed and untreated PCLS at 4 hours.
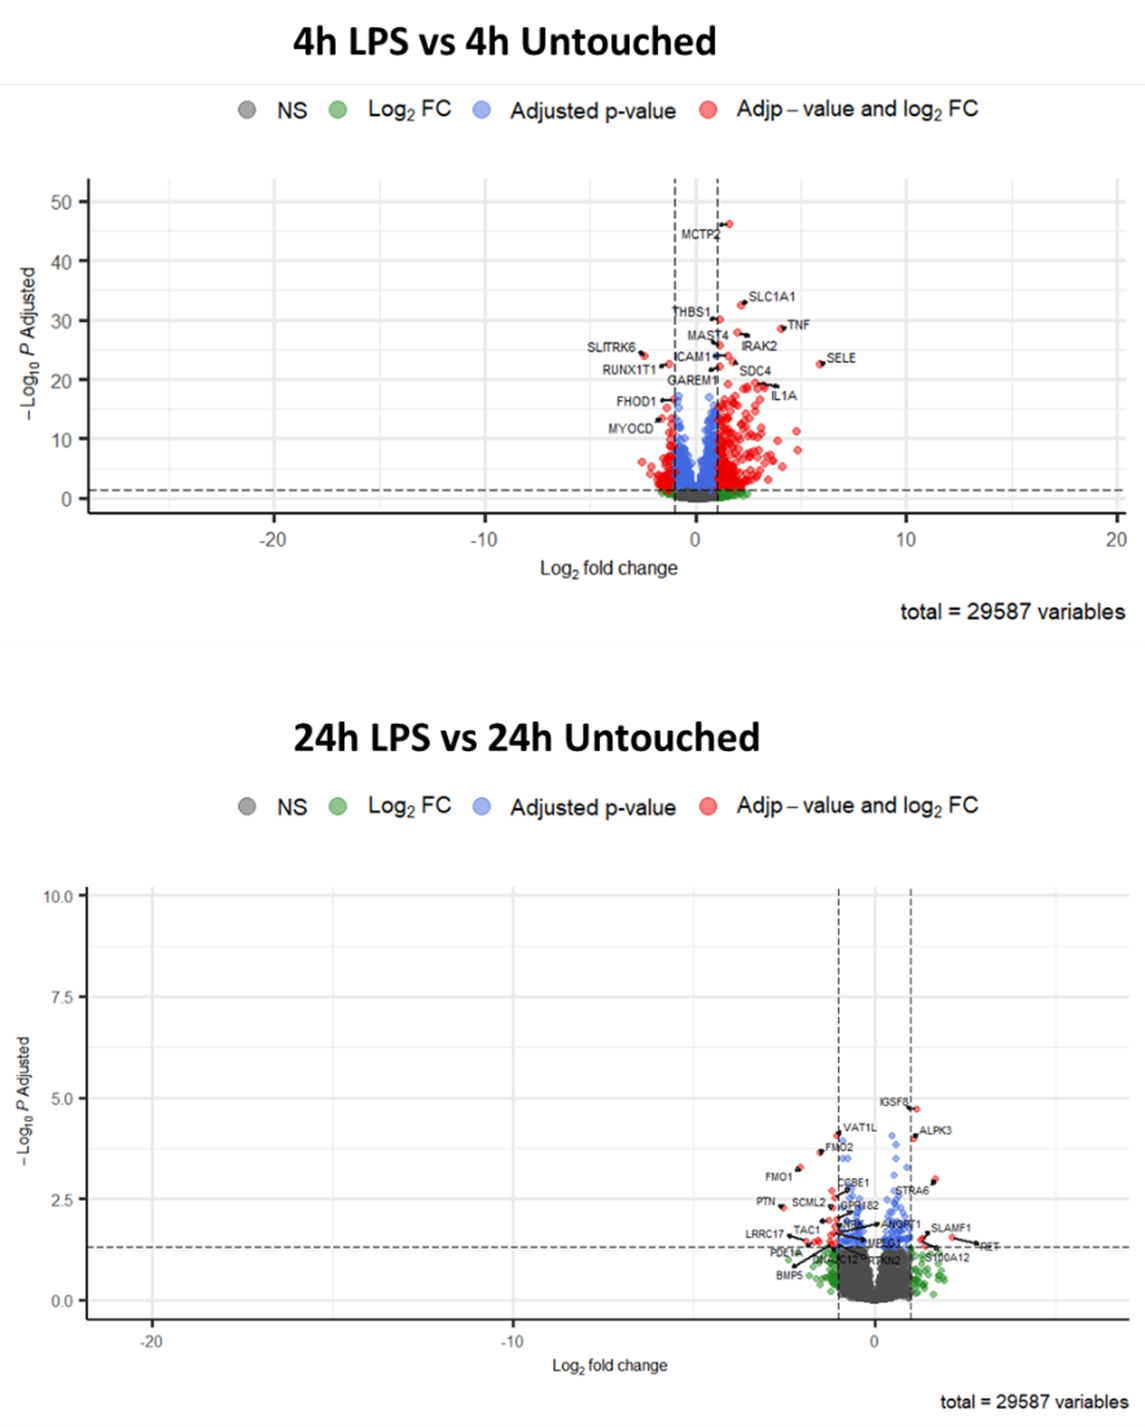 The upper panel represents the 4h exposure, and the lower panel the 24h exposure. Genes significantly up- or downregulated (|log₂FC| > 1, adjusted p < 0.05) are highlighted in red. LPS exposure at 4h induced strong upregulation of inflammatory genes such as TNF, IL1A, and SELE, while only a few DEGs were detected after 24h.
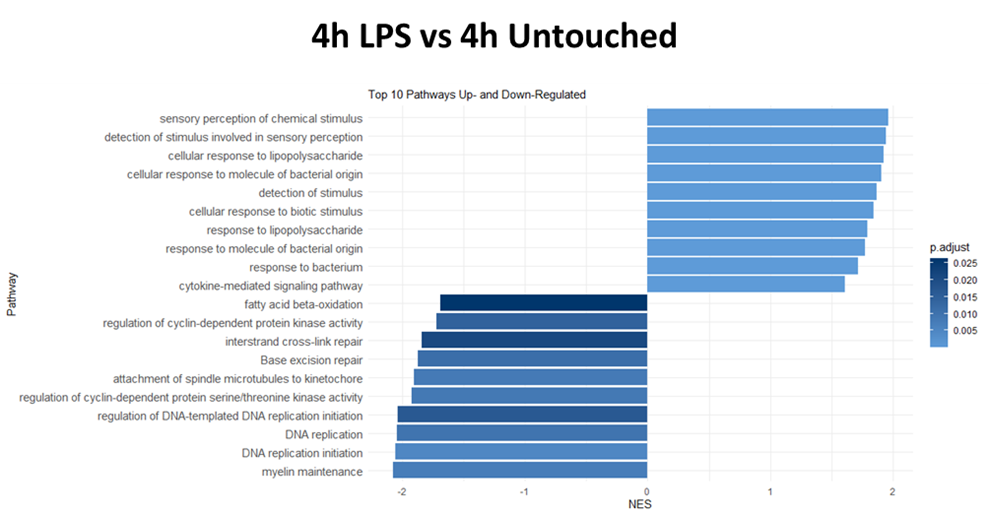 The bar plots display the top 10 upregulated and downregulated pathways when comparing LPS-treated and untreated samples at 4 hours. The normalized enrichment score (NES) is shown on the x-axis, indicating pathway activation or suppression; the scale gradient color indicates the adjusted p-value. Analyses were performed in R using GSEA.