
Neonatal Bilirubin Metabolism
Session: Neonatal Bilirubin Metabolism
 photo")
Mia DiCara, MD (she/her/hers)
General Pediatrics Resident
Ann & Robert H. Lurie Children's Hospital of Chicago
Long Grove, Illinois, United States
.png) White circles are adjusted in model II. Grey circles are unobserved or unadjusted. Base Deficit is the Exposure in green. Peak Bilirubin is the Outcome in blue. Paths of Total Effect between exposure and outcome are depicted in green arrows. Created with DAGitty (https://www.dagitty.net, Accessed: November, 2025).
White circles are adjusted in model II. Grey circles are unobserved or unadjusted. Base Deficit is the Exposure in green. Peak Bilirubin is the Outcome in blue. Paths of Total Effect between exposure and outcome are depicted in green arrows. Created with DAGitty (https://www.dagitty.net, Accessed: November, 2025). .png) LOESS (locally estimated scatterplot smoothing) lines were drawn only if ≥30 samples and ≥30 patients were available within a 12-hour window.
LOESS (locally estimated scatterplot smoothing) lines were drawn only if ≥30 samples and ≥30 patients were available within a 12-hour window. 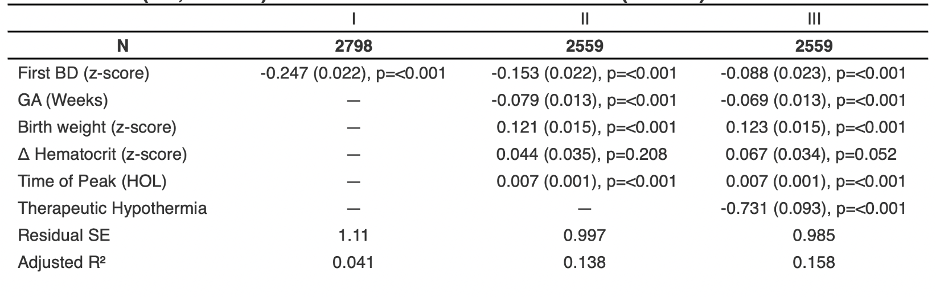 Model I is run without adjusting for any covariates. Model II is adjusted for covariates without adjusting for TH, reflecting the Total Effect of BD on peak bilirubin. Model III covariates include TH and represents the Direct Effect. Of note, the N drops for Model II and III because not all patients had two hematocrits available before peak bilirubin.