
Neonatal Neurology
Session: Neonatal Neurology 3: Clinical - Term 3
.jpeg.jpg "Vivek V. Shukla, MD (he/him/his) photo")
Vivek V. Shukla, MD (he/him/his)
Assistant Professor
University of Alabama at Birmingham
Birmingham, Alabama, United States
.png)
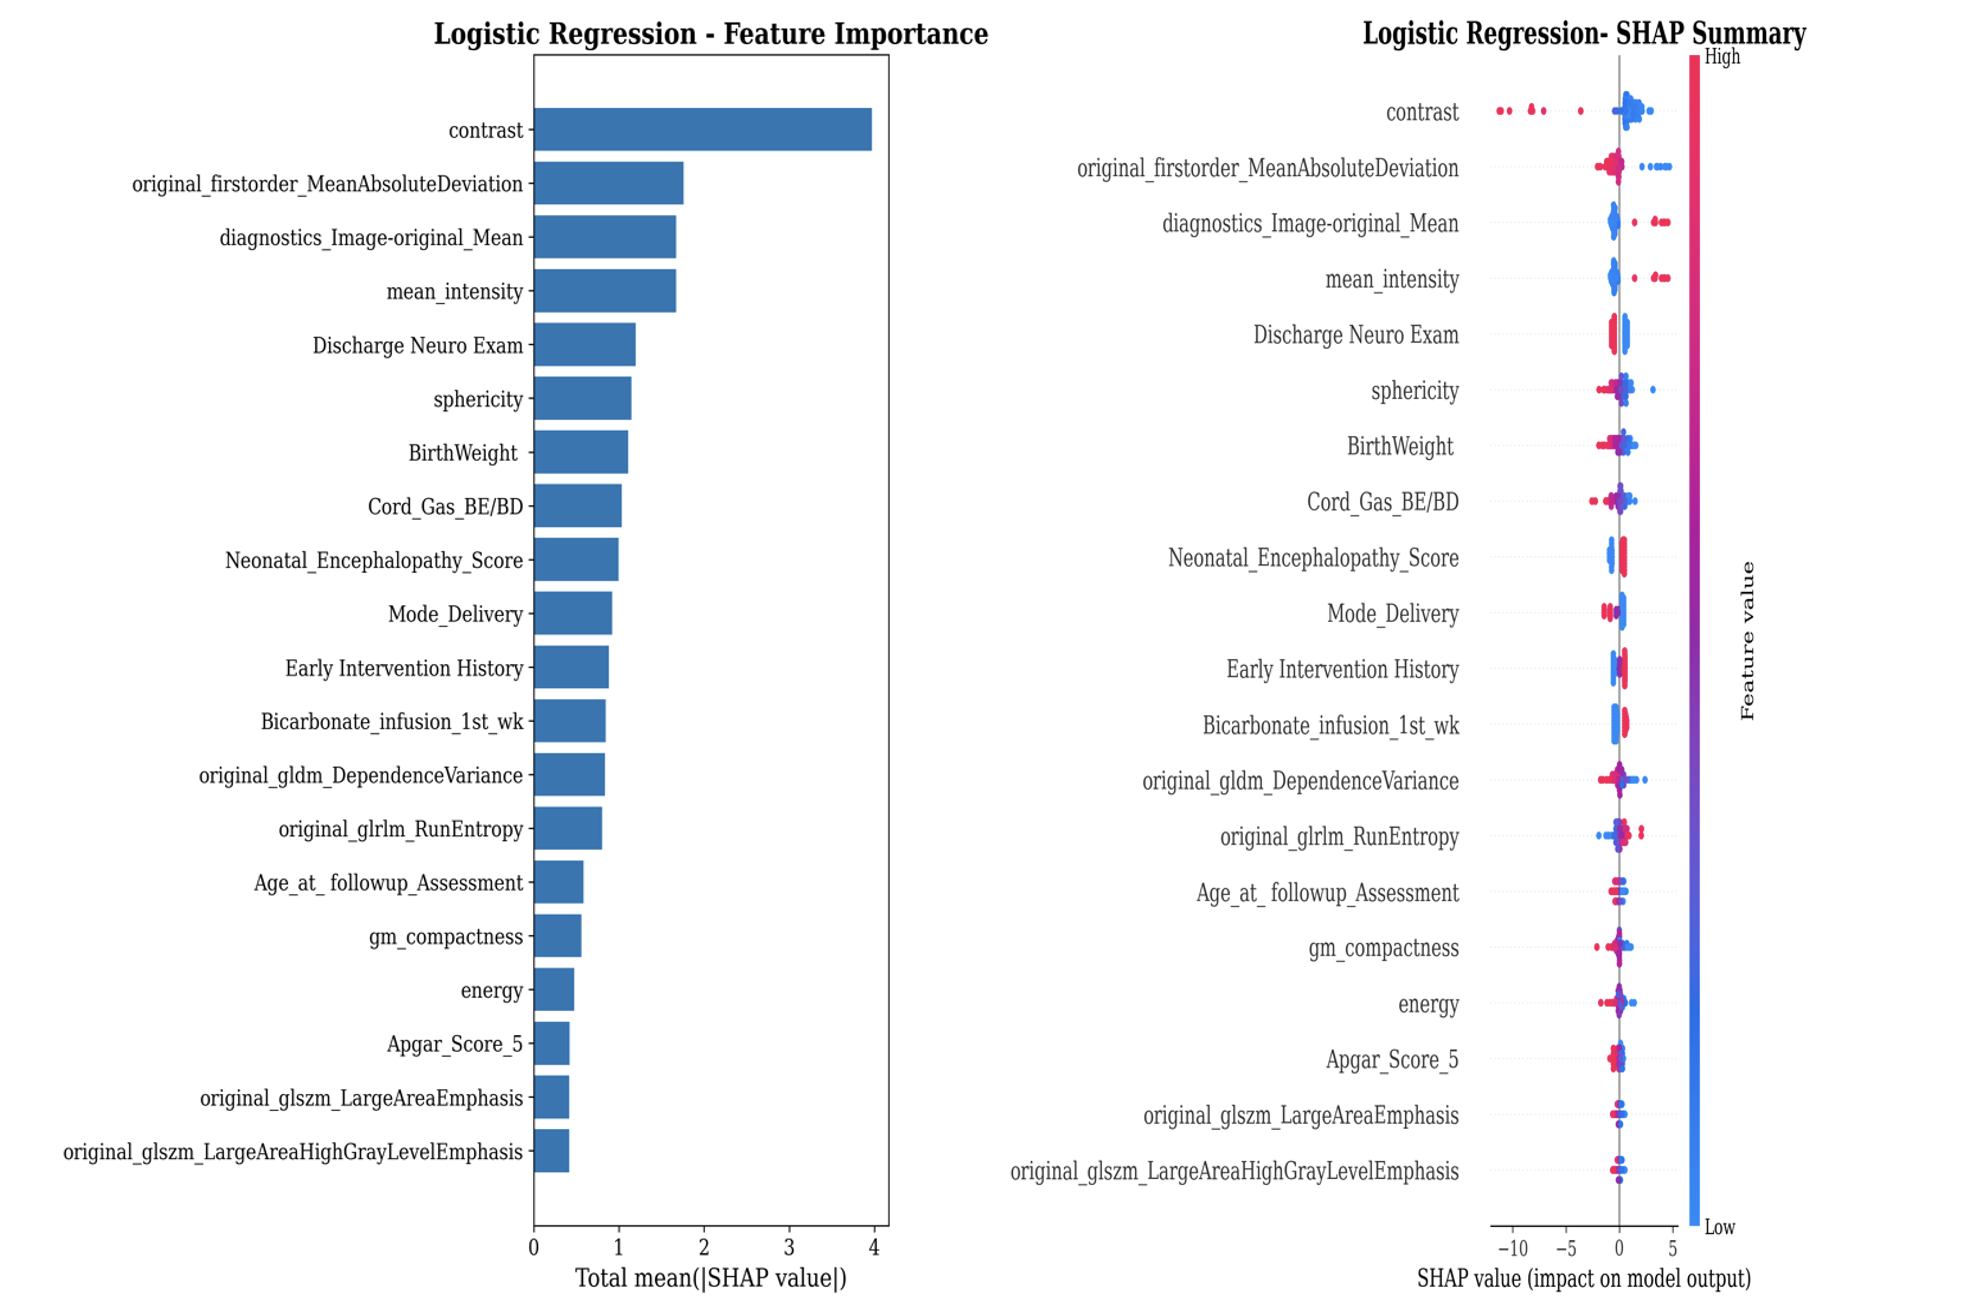 Left panel ranks features by mean absolute SHAP value. Right panel displays SHAP summary plots in which each dot represents a case (red = high feature value; blue = low feature value) and horizontal position indicates whether the feature value increases (right) or decreases (left) predicted risk of a severe outcome.