
Neonatal Pulmonology
Session: Neonatal Pulmonology - Clinical Science 3: Imaging and Pulmonary Hypertension Issues
.jpg "Zohaib Sayyed, MD (he/him/his) photo")
Zohaib Sayyed, MD (he/him/his)
Fellow
Connecticut Children's Medical Center
Manchester, Connecticut, United States
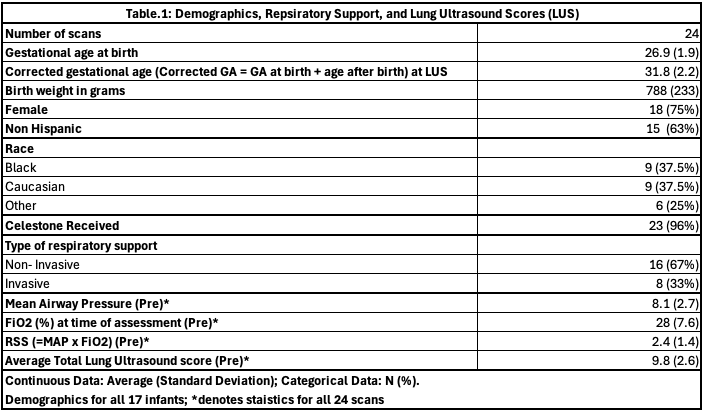 Table 1: Demographics, Respiratory Support, and Lung Ultrasound Scores
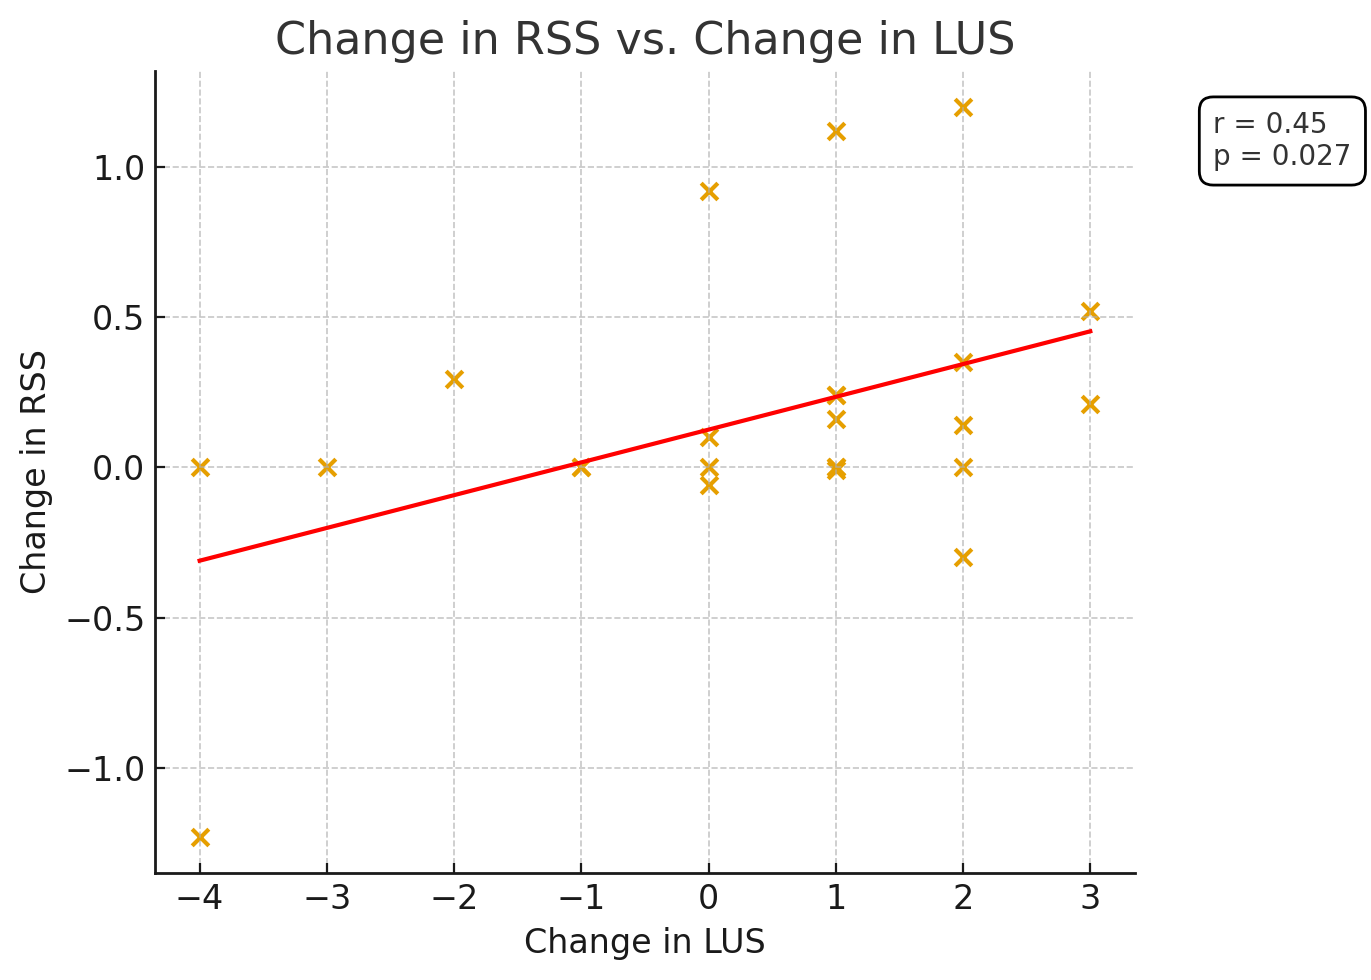 Figure 1. Association between change in Lung Ultrasound Score and change in Respiratory Severity Score. Each point represents a paired observation (N = 24). Linear regression analysis showed a moderate positive correlation (r = 0.45, p = 0.027), suggesting that shifts in LUS track with concurrent changes in respiratory severity.
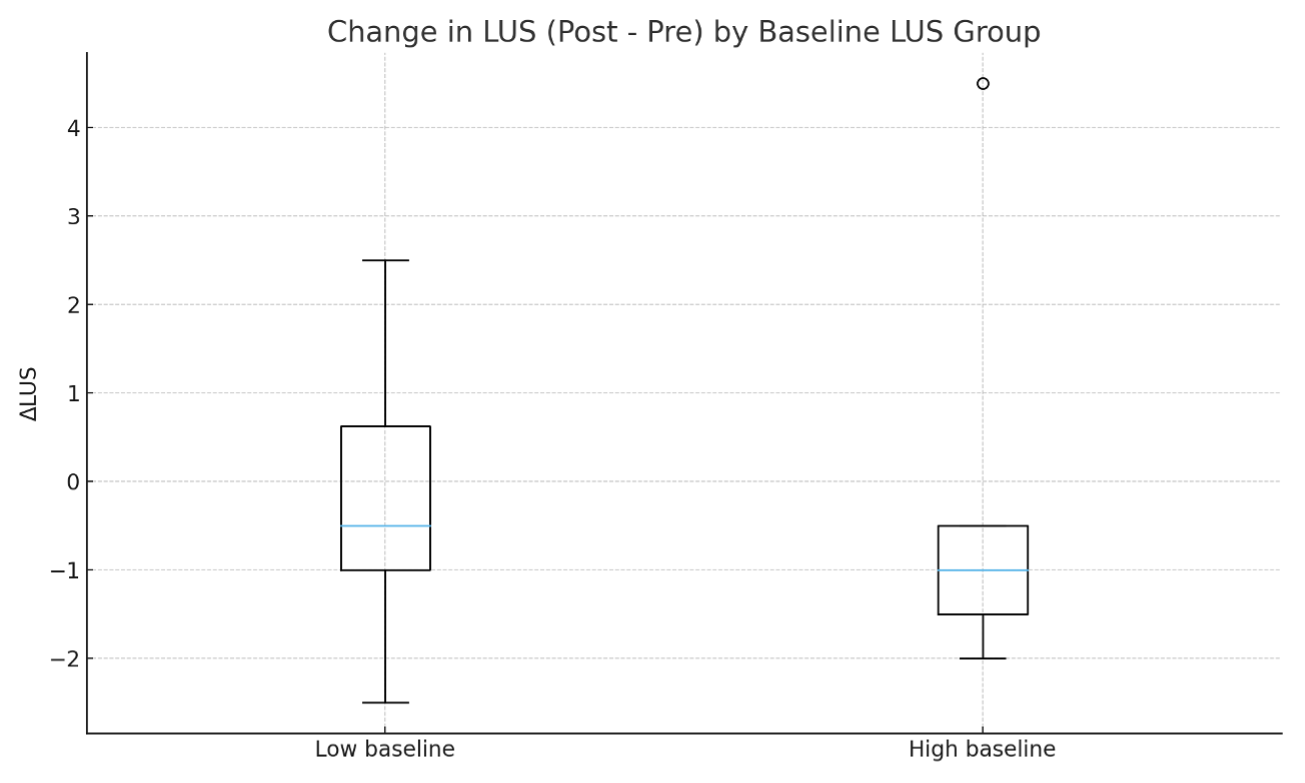 Figure 2. Change in Lung Ultrasound Score stratified by baseline LUS. Box-and-whisker plots compare infants with high baseline LUS ≥10 (N=12) versus low baseline LUS <10 (N=12). The high-baseline group demonstrates a larger reduction in LUS (more negative ΔLUS; lower median and tighter IQR), indicating greater improvement from pre- to post-assessment.