
Neonatal Neurology
Session: Neonatal Neurology 3: Clinical - Term 3
 photo")
Anoop Ramana, MBBS MRCPCH (he/him/his)
Senior Clinical Academic Fellow
Imperial College Healthcare NHS Trust
London, England, United Kingdom
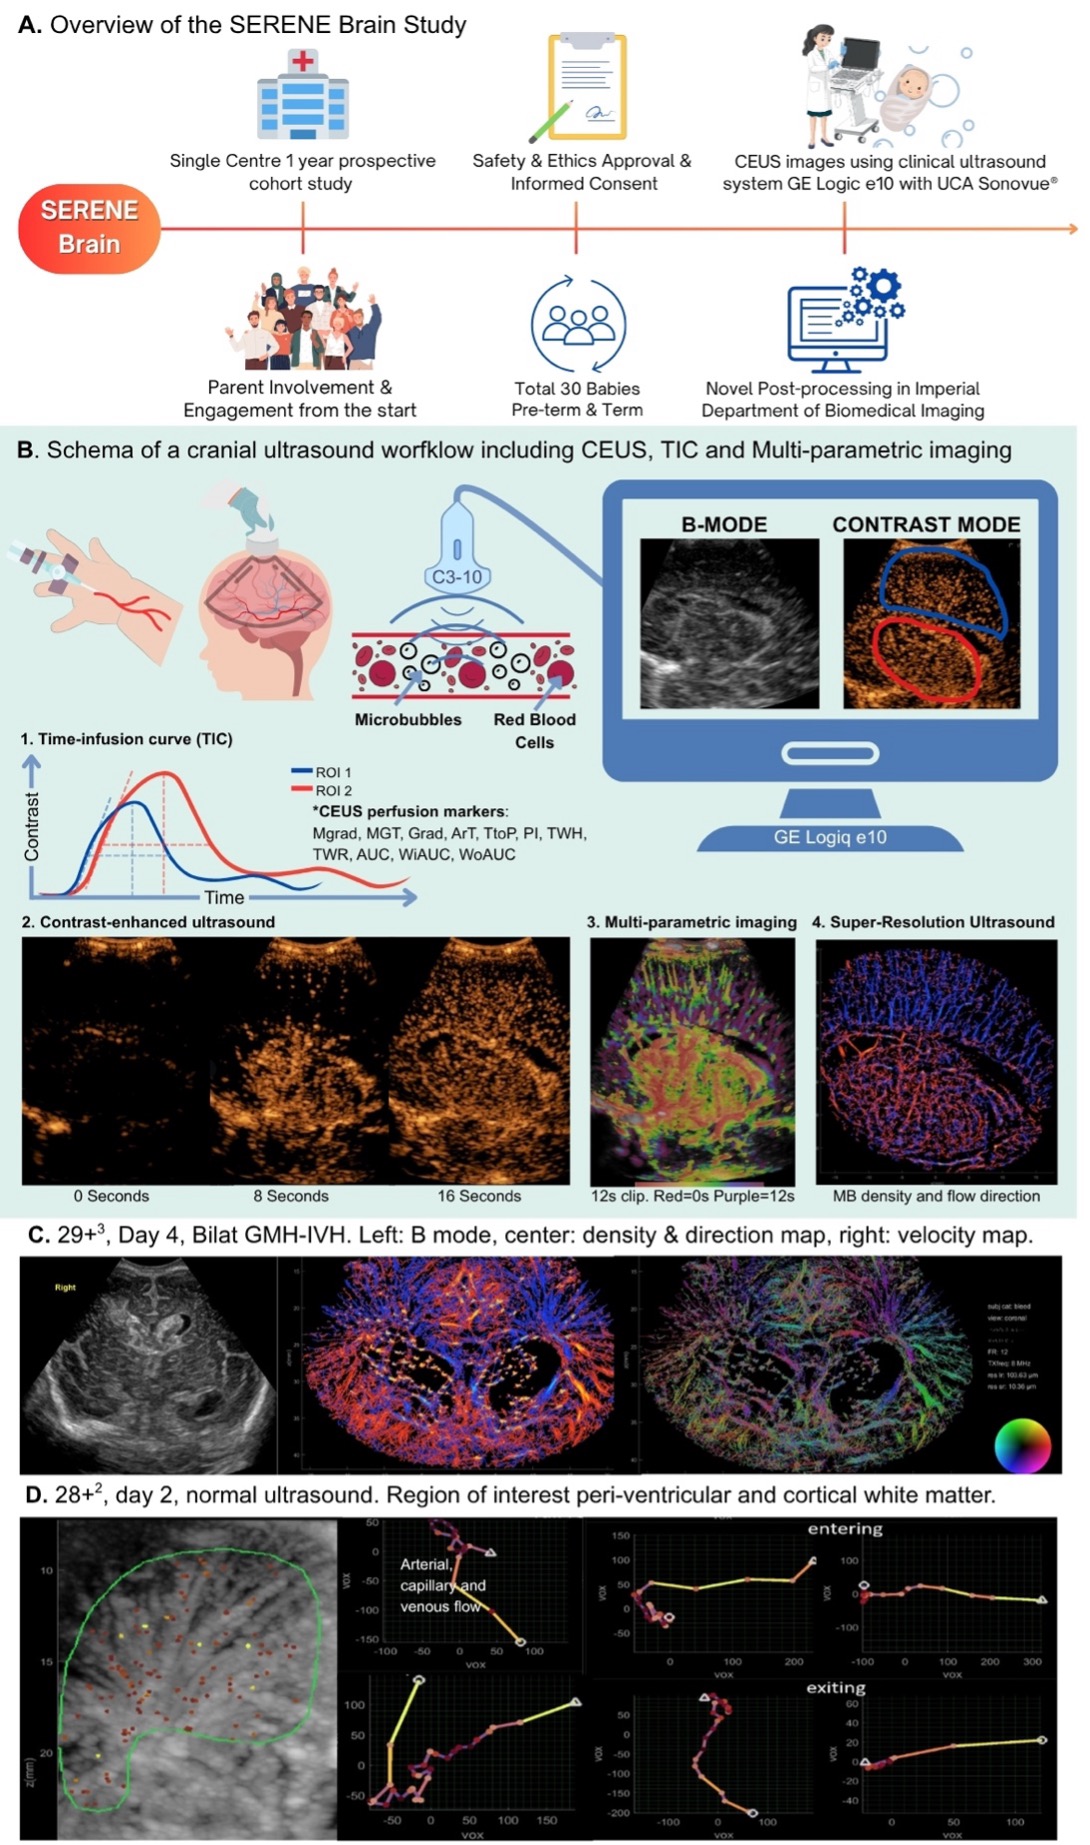 A. Overview of the SERENE Brain Study. B. Schema of a cranial ultrasound workflow including CEUS, Time infusion/intensity curve analysis (TIC) using perfusion markers (Mgrad: Max gradient, MGT: Max gradient time, Grad: Mean gradient (to the peak), ArT: Arrival time, TtoP: Time to peak, PI: Peak intensity, TWH: Time width at half maximum, TWR: Time width ratio, AUC: Area under the curve, WiAUC: Wash in area under the curve, WoAUC: Wash out are under the curve), CEUS, multi-parametric imaging and SRUS. C. Left: B-mode scan of a female infant born 29+3 weeks gestation (1443g) performed on day 4 of life. Centre: Microbubble (MB) density map demonstrating microvascular differences between Right sided Papile Grade IV GMH-IVH and HPI and Left sided Grade III GMH-IVH with rim enhancement of ventricle and periventricular vessel engorgement. Right: Direction map with corresponding colour code depicting Left sided flow direction in peri-ventricular vessels. D. Left: Right cortical and periventricular white matter region of interest (green) with individual microbubbles selected for "Capillary transit time" CTT analysis; right: single microbubble trajectories going through the capillary bed.
 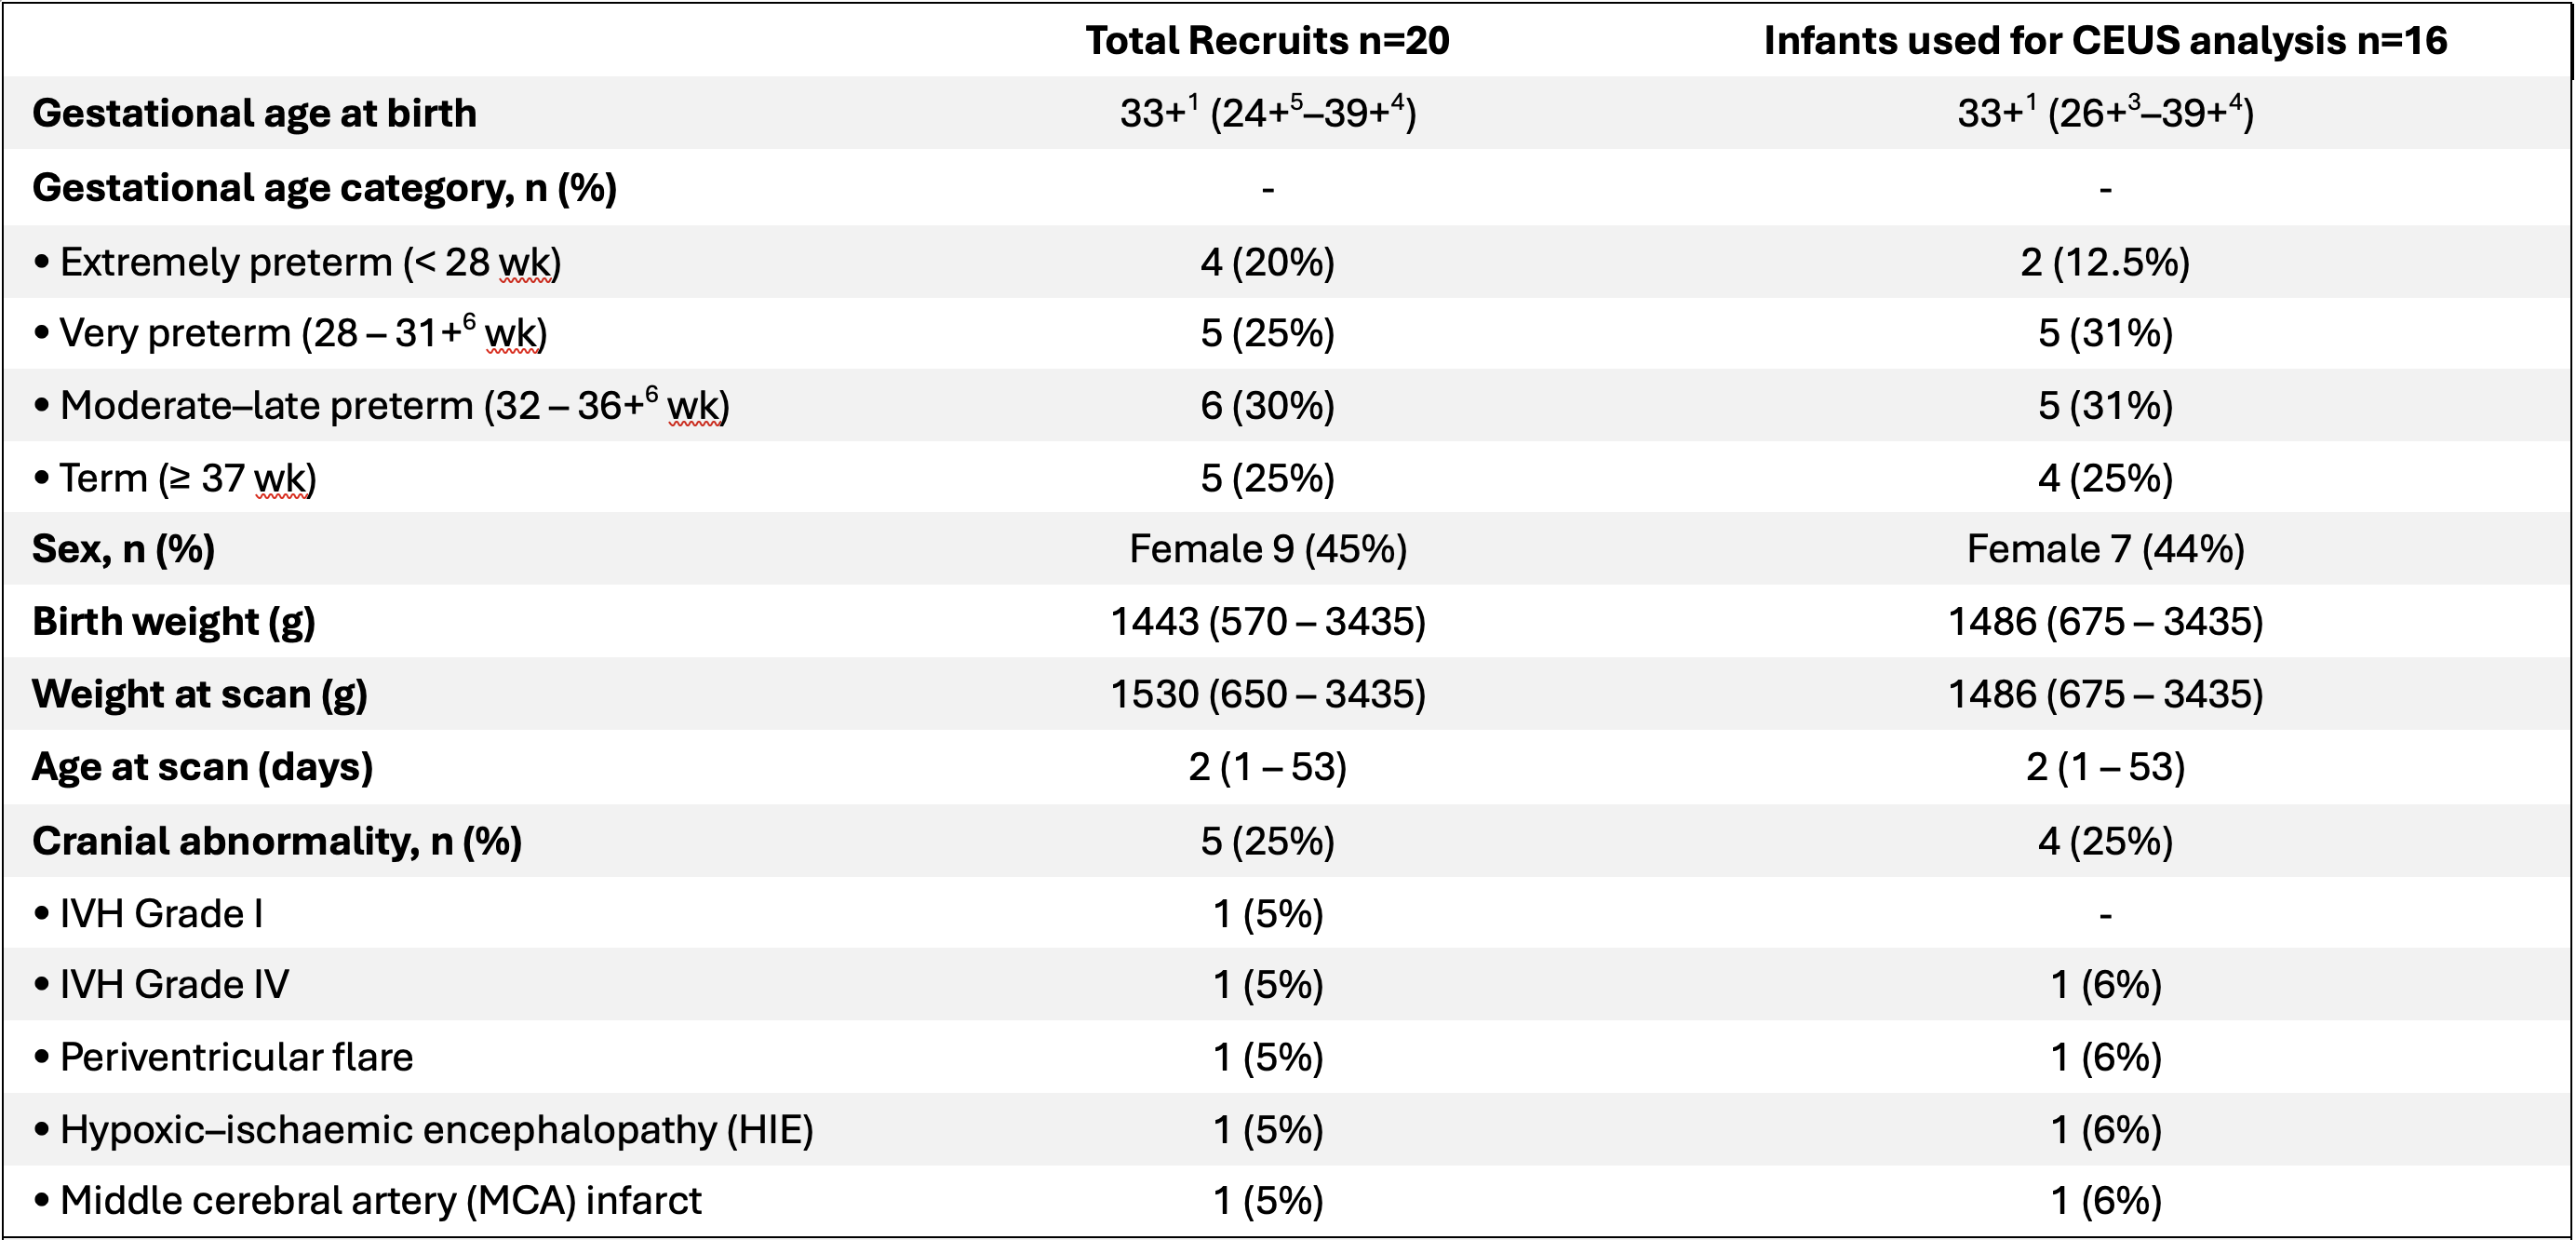 Baseline demographic and clinical characteristics of enrolled neonates included in the SERENE Brain feasibility cohort. 4 scans were used to optimise imaging protocol thus were not included in the final analysis as images were not standardised. Values are median (range) for continuous variables and n (%) for categorical variables. IVH = Intraventricular haemorrhage.
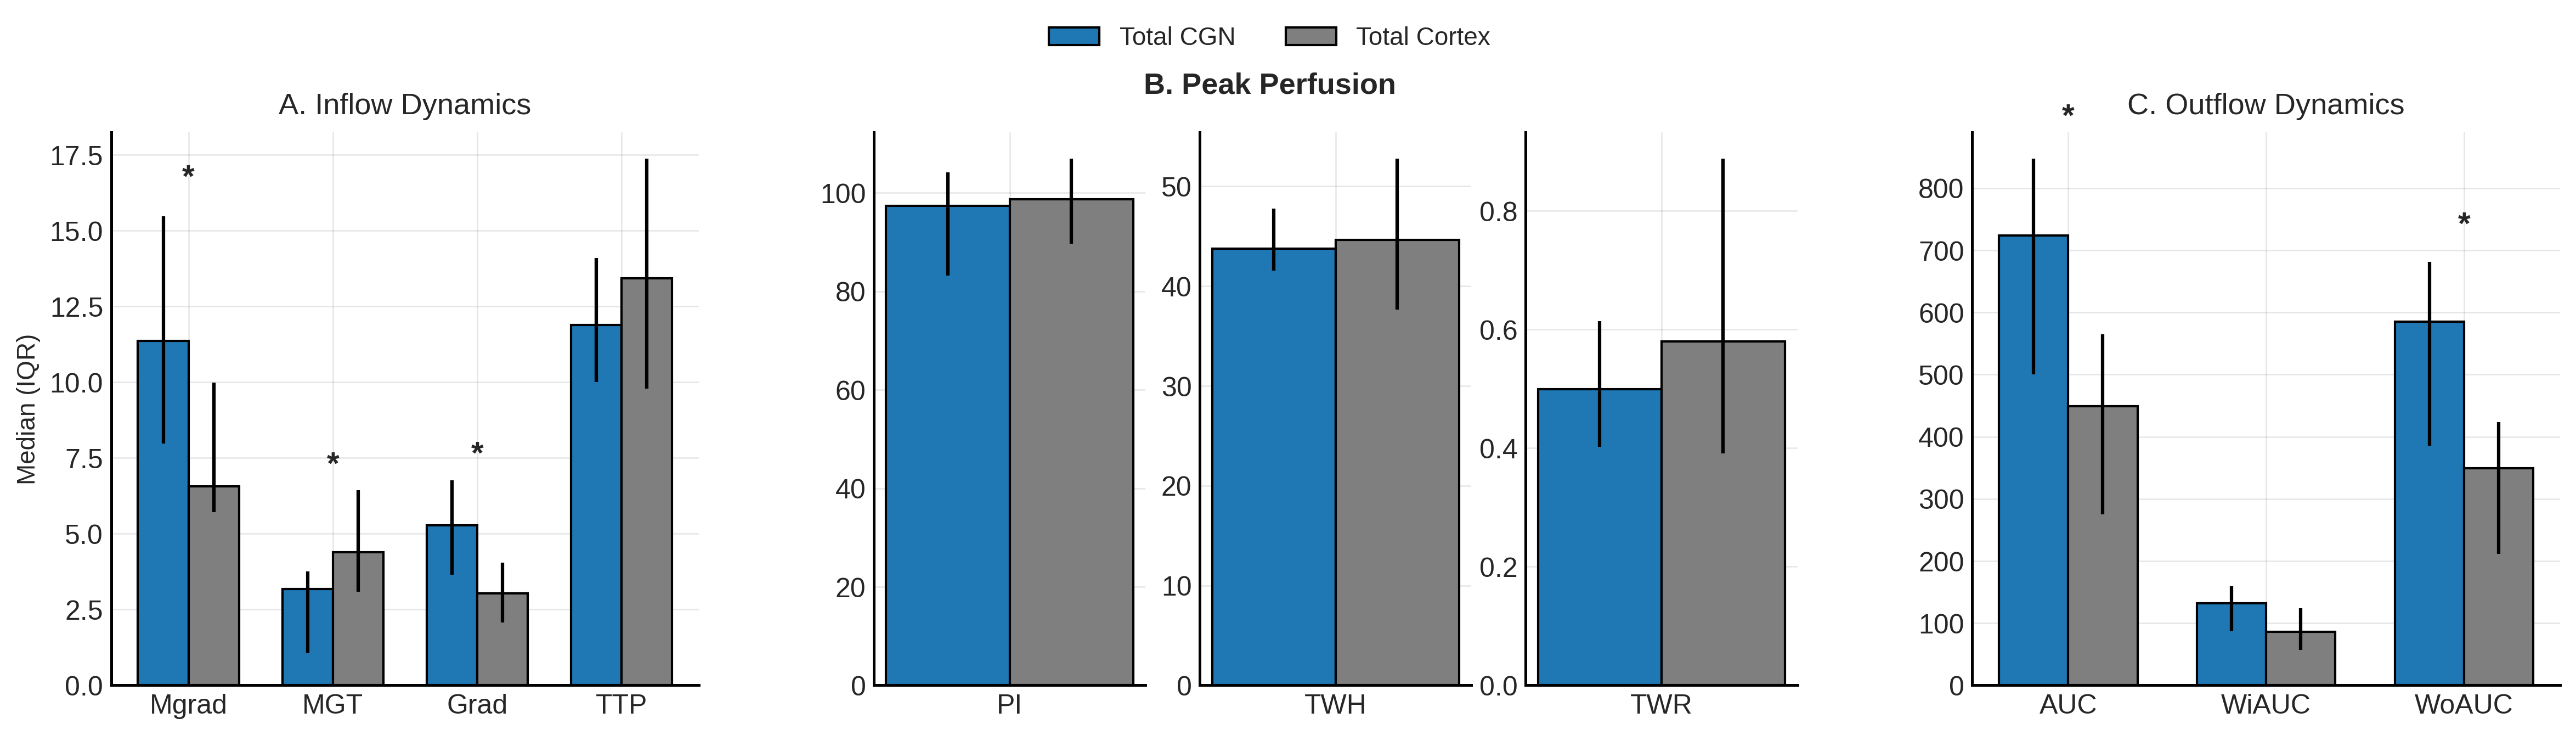 Quantitative CEUS perfusion metrics derived from time-intensity curve analysis in the central-grey nuclei (CGN) and cortical regions of the neonatal brain. Parameters were grouped according to contrast phase: A: inflow dynamics or arterial inflow (Mgrad - dB/sec, MGT - sec, Grad - dB/sec, TTP - sec), B: peak phase or indicative capillary perfusion (PI - dB, TWH - sec, TWR), and C: outflow or venous drainage (AUC*, WiAUC, WoAUC). *AUC is indicative of the total perfusion over time (inflow + outflow). CGN regions demonstrated significantly steeper gradients and greater AUC values, suggesting higher perfusion efficiency and vascular reactivity compared with cortical regions. Whiskers indicate interquartile ranges; asterisks denote parameters with significant regional differences (p < 0.05). Abbreviations: Mgrad: Max gradient, MGT: Max gradient time, Grad: Mean gradient (to the peak), ArT: Arrival time, TtoP: Time to peak, PI: Peak intensity, TWH: Time width at half maximum, TWR: Time width ratio, AUC: Area under the curve, WiAUC: Wash in area under the curve, WoAUC: Wash out are under the curve)