630 - The Impact of Updated 2025 Fenton Growth Curves on Preterm Infant Malnutrition and Growth Patterns
Friday, April 24, 2026
5:30pm - 8:00pm ET
Publication Number: 1607.630
Maggie Jerome, Oregon Health & Science University, Portland, OR, United States; Arianna B. Kapileo, Oregon Health & Science University School of Medicine, Portland, OR, United States; Molly T. Aloia, Oregon Health and Science University, Portland, OR, United States; Madeline A. Hedges, Oregon Health & Science University School of Medicine, Beaverton, OR, United States; Rachel F. Pung, Oregon Health & Science University School of Medicine, Hillsboro, OR, United States; Brian Scottoline, Oregon Health & Science University, Portland, OR, United States
Assistant Professor Oregon Health and Science University Portland, Oregon, United States
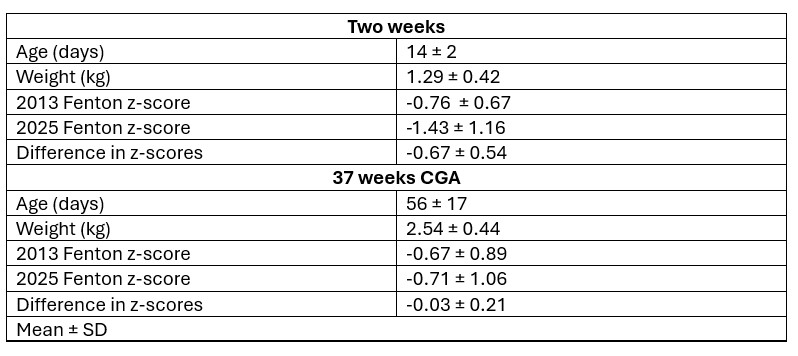
Background: Preterm infants are at risk for nutritional deficiencies and growth faltering, which are associated with poor long-term neurodevelopmental outcomes. Growth is monitored in the neonatal intensive care unit (NICU), utilizing intrauterine growth charts and calculated z-scores based on reference growth data, most commonly the 2013 Fenton Growth Charts. New Fenton growth charts were released in 2025, excluding infants with morbidities that affected fetal growth. The impact of this new growth reference on malnutrition rates in the NICU is unknown. Objective: To compare weight z-scores using the 2013 vs 2025 Fenton growth charts and evaluate the impact of the 2013 vs 2025 Fenton growth charts on rates of malnutrition. Design/Methods: This secondary analysis utilized data from an ongoing stool microbiome study [IRB #21952] from 2020 to present. We analyzed data from 100 infants. Weights were collected weekly on Mondays and z-scores were calculated using 2013 Fenton growth charts. Weight z-scores were re-calculated using 2025 Fenton growth charts for this analysis. Differences between the Fenton 2013 vs 2025 z-scores were assessed at two weeks of age and 37 weeks corrected gestational age. Malnutrition was assessed using Academy of Nutrition and Dietetics/American Society for Parenteral and Enteral Nutrition criteria at each time point (calculating change in weight z-score from birth to time point). Descriptive statistics were performed using Excel. Results: N=100 infants 28.61 ± 2.35 gestational age and weighing 1.17 ± 0.39 kg at birth were included in this analysis. Using the 2025 Fenton growth charts as a reference, weight z-scores were -0.34 at birth compared with 2013 Fenton growth charts. At two weeks of age, weight z-scores were -0.67 using 2025 reference data and 71% of infants met criteria for malnutrition compared with 45% using 2013 data. At 37 weeks, the difference in the 2025 vs 2013 weight z-scores was minimal at -0.03. 25.5% of infants met criteria for malnutrition using 2025 reference data vs 33% of infants with 2013 reference data.
Conclusion(s): Use of the 2025 Fenton growth charts data to calculate weight z-scores and assess malnutrition resulted in higher rates of malnutrition (including moderate and severe malnutrition) at two weeks of life. By 37 weeks CGA, differences in weight z-scores were minimal and malnutrition rates were similar. Use of the 2025 Fenton Growth charts in practice will likely result in increased rates of malnutrition assessed by dietitians, potentially changing nutrition interventions, reimbursement rates, and quality measures.
Table 1: Baseline Characteristics
Table 2: Growth Outcomes at two weeks of life and 37 weeks corrected gestational age
Figure 1: Malnutrition rates at (A) two weeks of life and (B) 37 weeks corrected gestational age using Fenton 2025 vs 2013 growth chart reference data

.jpg)
.jpg)
