
Technology
Session: Technology 1: AI in Pediatrics

Cassandra Josephson, MD
Director, Cancer and Blood Disorders Institute and Director, Blood Bank, Transfusion, Apheresis Division, Pathology, Johns Hopkins All Children's Hospital
Medtronic
St. Petersburg, Florida, United States
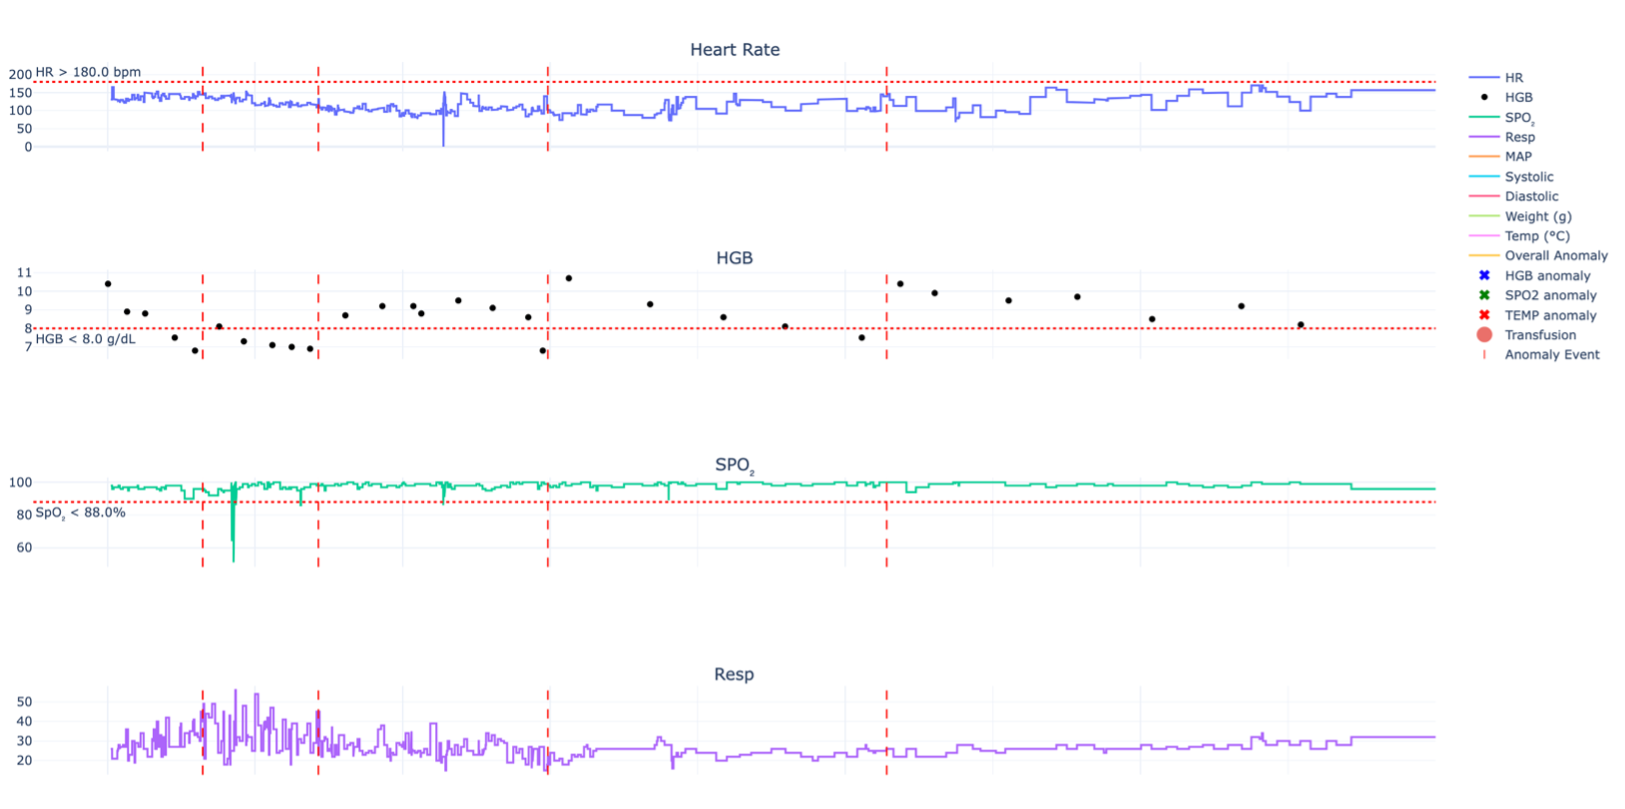 TransfusaScope's clinician-facing interactive dashboard including vital signs from the top down: heart rate in beats per minute, hemoglobin in g/dL, percent oxygen saturation, and respiratory rate in breaths per minute. Vertical dashed lines represent a transfusion event. Horizontal dashed lines represent a predetermined threshold of abnormality.
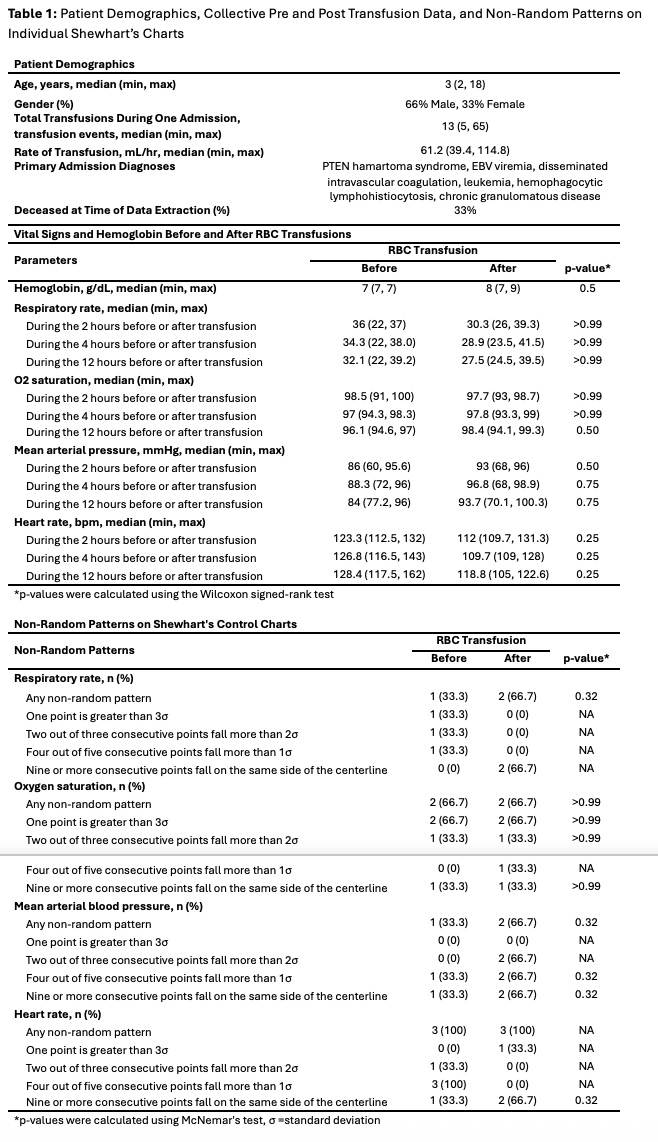 Patient Demographics, Collective Pre and Post Transfusion Data, and Non-Random Patterns on Individual Shewhart's Charts
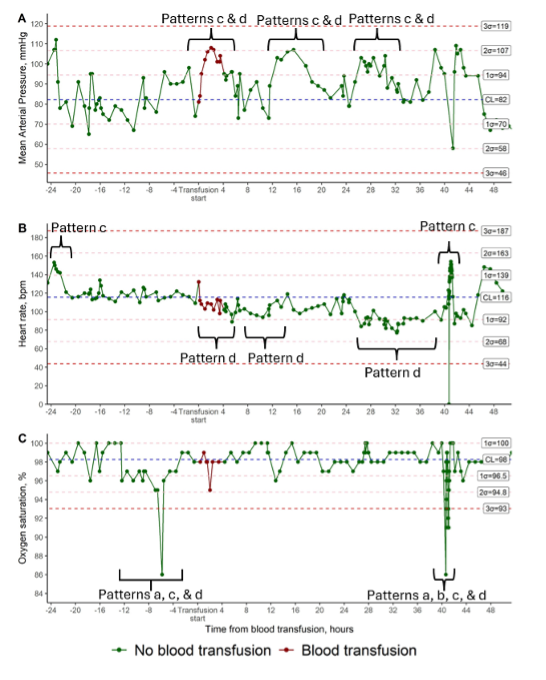 A Shewhart control chart (Nelson, L., 2018) displaying MAP, HR, and SpO2. σ =standard deviation, CL=centerline (mean). Red corresponds with measurements during active transfusion and green corresponds with outside of active transfusion. Patterns: a=One point is greater than 3 standard deviations from the center line. b= Two out of three consecutive points fall more than 2 standard deviations from the center line. c= Four out of five consecutive points fall more than 1 standard deviation from the centerline. d=Nine or more consecutive points fall on the same side of the centerline.