
Neonatal Quality Improvement
Session: Neonatal Quality Improvement 2
 Credit")
Gabriela Ulloa, MD (she/her/hers)
Fellow
Weill Cornell Medicine
New York, New York, United States
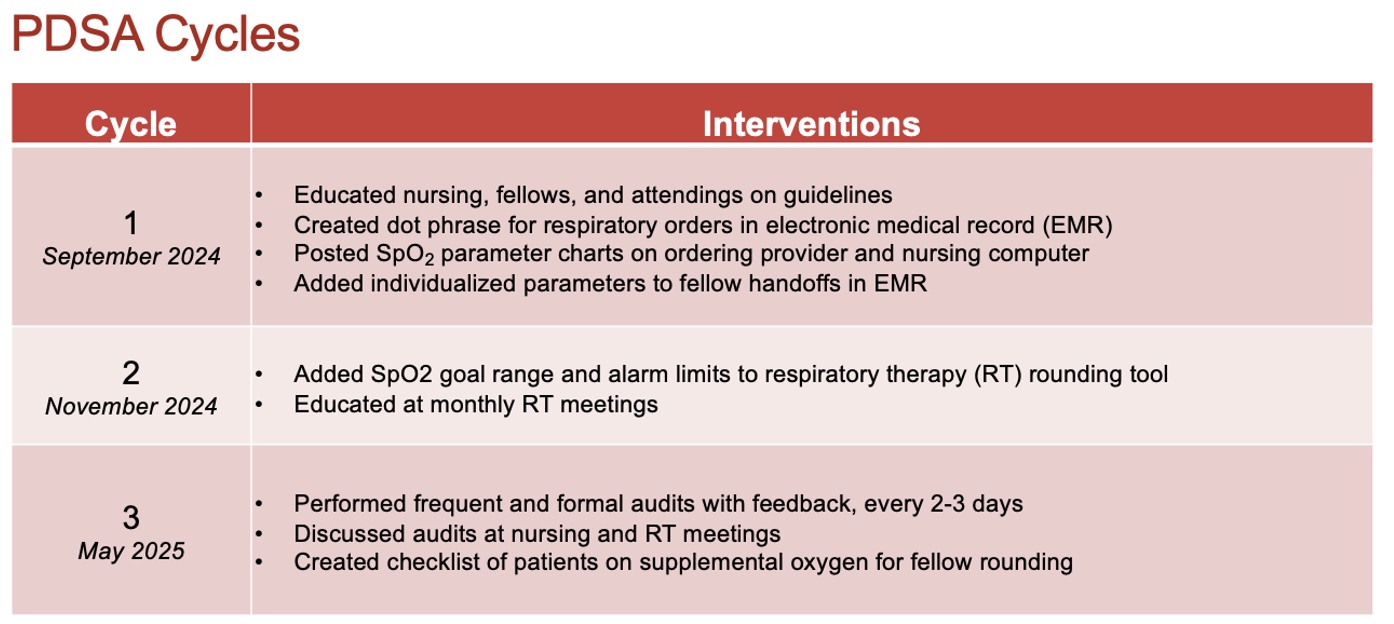 PDSA cycles and interventions
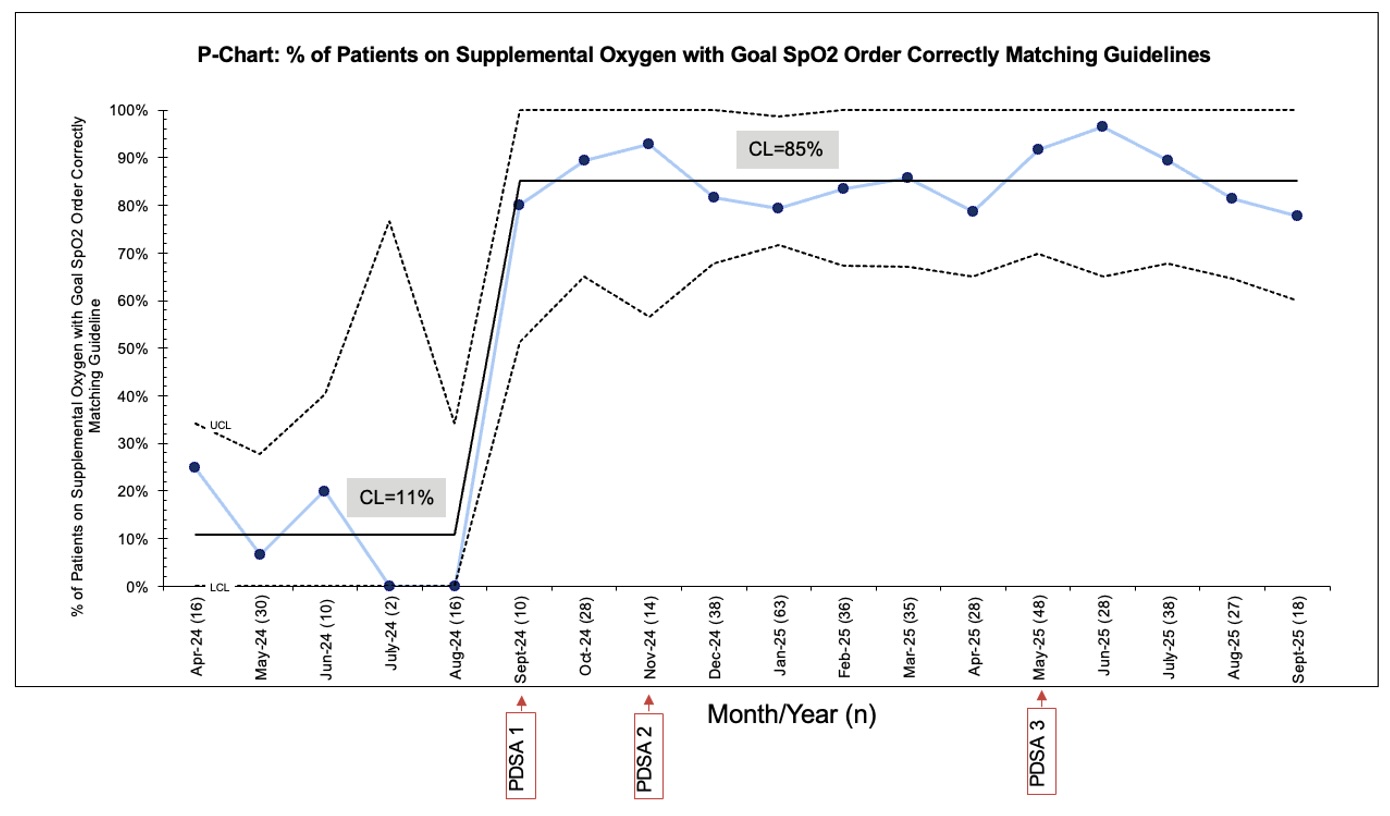 P-chart displaying percentage of patients on supplemental oxygen with goal SpO2 order correctly matching guidelines. X-axis is time (month/year); number of patients included in parentheses. Y-axis is the percentage of patients with correct order. Arrows with PDSA cycle number indicating time of intervention. The solid line indicates the center line (CL). Dashed lines indicate upper control limit (UCL) and lower control limit (LCL).
 .jpg) X-bar S chart displaying mean percentage of time spent within goal SpO2 range for patients on supplemental oxygen and standard deviation over time. X-axis is time (month/year); number of patients included in parentheses. Y-axis is the percentage of time spent within goal SpO2 range. Arrows with PDSA cycle number indicating time of intervention. The solid line indicates the center line (CL). Dashed lines indicate upper control limit (UCL) and lower control limit (LCL).
X-bar S chart displaying mean percentage of time spent within goal SpO2 range for patients on supplemental oxygen and standard deviation over time. X-axis is time (month/year); number of patients included in parentheses. Y-axis is the percentage of time spent within goal SpO2 range. Arrows with PDSA cycle number indicating time of intervention. The solid line indicates the center line (CL). Dashed lines indicate upper control limit (UCL) and lower control limit (LCL).