
Neonatal GI Physiology & NEC
Session: Neonatal GI Physiology & NEC 3
.jpg "Naomi G. Wilson, PhD (she/her/hers) photo")
Naomi G. Wilson, PhD (she/her/hers)
Bioinformatics Scientist II
Childrens Hospital of Philadelphia
St Louis, Missouri, United States
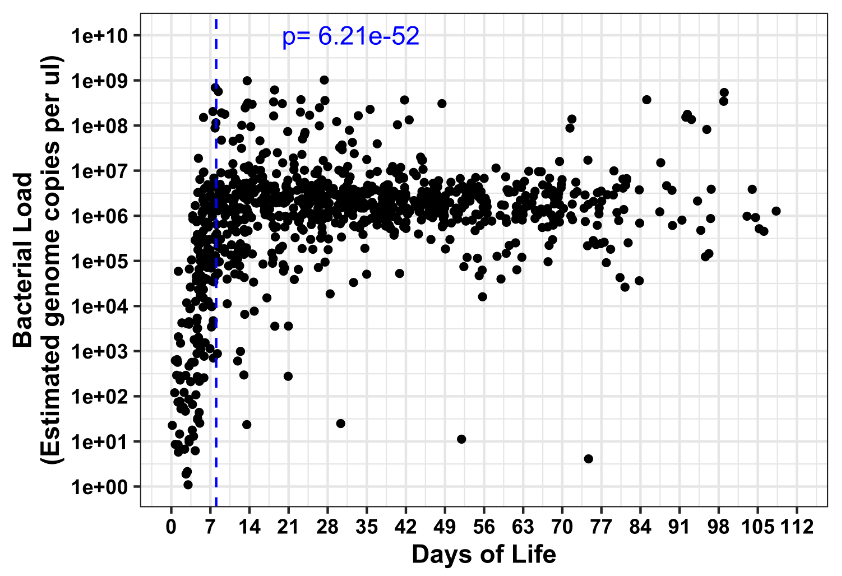 Bacterial load in log-scale of the stool samples is shown on the y-axis, with days of life of the infant at stool sampling on the x-axis. Each point represents one stool sample from one individual. Segmented breakpoint analysis performed, and one breakpoint was found, marked with a dashed blue line and blue p-value. When fitting a linear model to the log-transformed bacterial load values, R package segmented::segmented selected a breakpoint at 8 days of life (dashed blue line) at p<0.0001 with a 95% confidence interval 7.5-8.5.
.png) Samples obtained ≥8 days were grouped by their highest relative abundance genus of at least 25% and each group's bacterial load was compared to the global mean with a t-test.
Samples obtained ≥8 days were grouped by their highest relative abundance genus of at least 25% and each group's bacterial load was compared to the global mean with a t-test.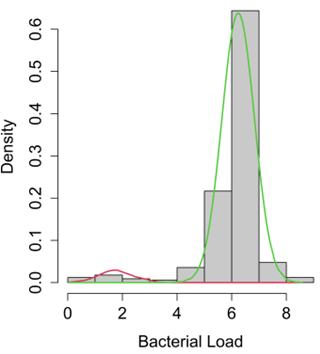 A 2-component Gaussian Mixture Model was fit to the data: the red curve traces the density fit of the low bacterial load samples and the green curve traces the density fit of the higher bacterial load samples. The relative likelihood of the data fitting better to a single normal distribution compared to a 2-component GMM is very low (7.9E-64). X-axis is the log-transformed estimated genome copies per ul in Klebsiella-dominated fecal samples