
Neonatal Neurology
Session: Neonatal Neurology 6: Prenatal

Josepheen De Asis-Cruz, MD, PhD
Associate Research Professor
Children's National Hospital
Washington DC, District of Columbia, United States
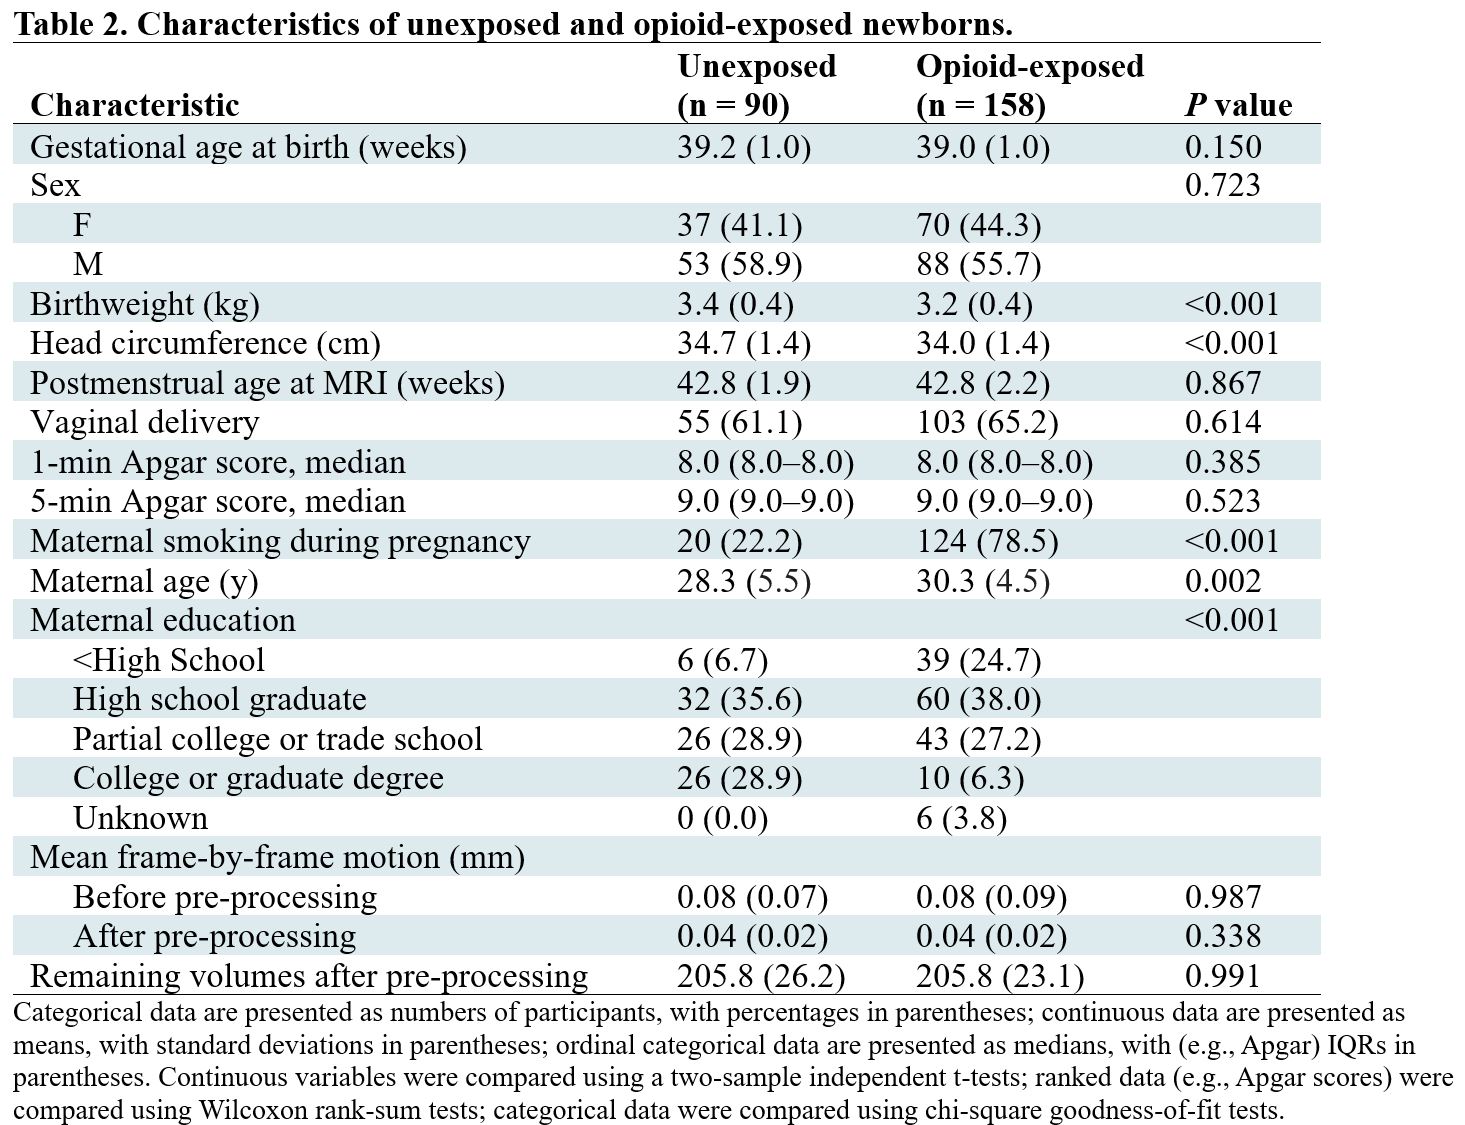 Categorical data are presented as numbers of participants, with percentages in parentheses; continuous data are presented as means, with standard deviations in parentheses; ordinal categorical data are presented as medians, with (e.g., Apgar) IQRs in parentheses. Continuous variables were compared using a two-sample independent t-tests; ranked data (e.g., Apgar scores) were compared using Wilcoxon rank-sum tests; categorical data were compared using chi-square goodness-of-fit tests.
 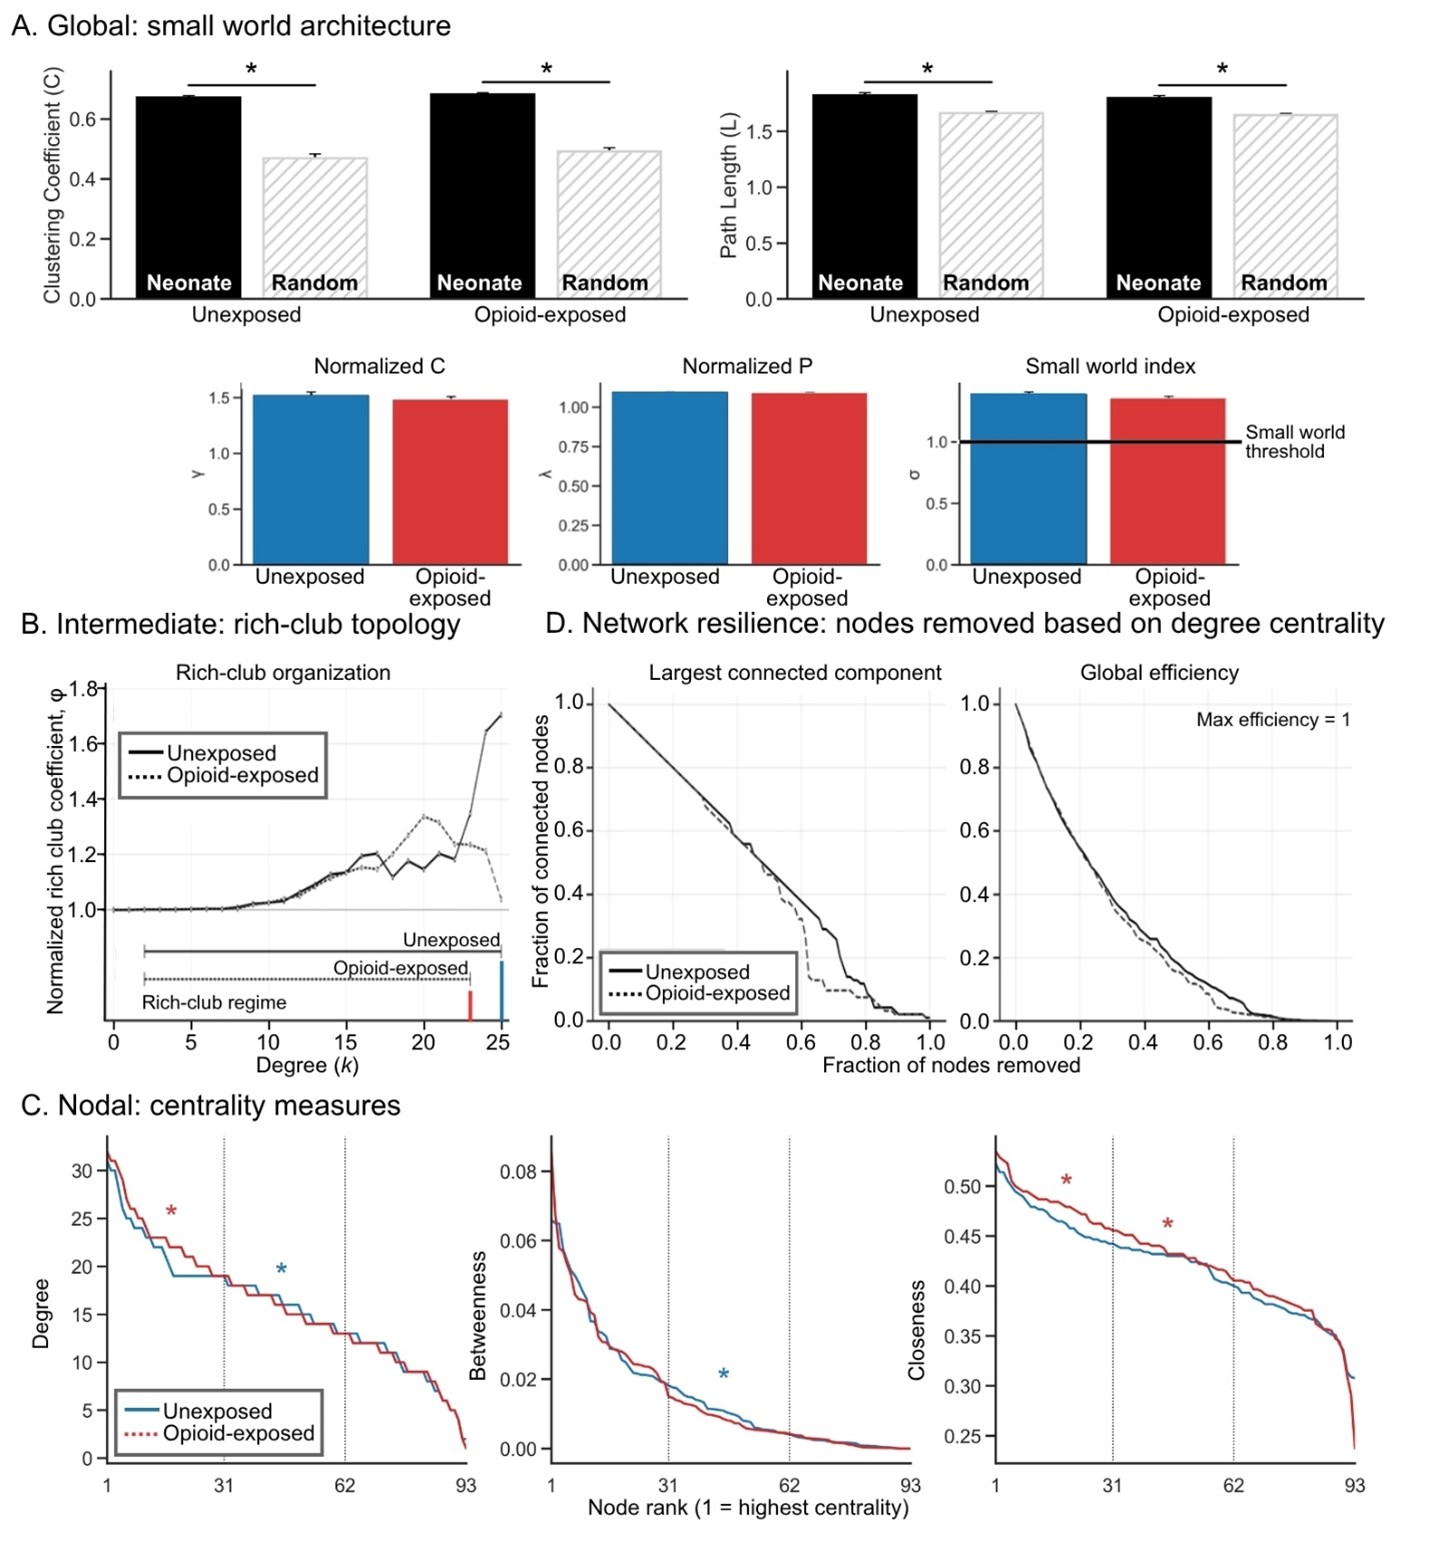 Figure 1. (A) Opioid-exposed neonates' resting state networks exhibit small world topology. Like unexposed neonates, opioid-exposed neonates clustering coefficient (C) and characteristic path length (L) greater than random networks' C and L. In addition, small world index ≥ 1. (B) Rich club organization is preserved in opioid-exposed neonates (rich club coefficient, φnorm > 1), but for a narrower range of degree (k) values. Blue = unexposed range; red = opioid-exposed range. (C) Network hubs in opioid-exposed neonates exhibit higher degree and closeness centrality. While node rankings were similar, the degree and closeness of the most influential nodes (ranked in the top third) were higher in opioid-exposed (red) compared to unexposed neonates (blue). (D) Networks of opioid-exposed neonates are less resilient to perturbation compared to unexposed neonates. Response to targeted removal of degree hubs on the largest connected cluster (left) and global efficiency (right) is shown.