
Neonatal Less Than 25 weeks
Session: Neonatal Less Than 25 Weeks 1: Physiology and Management
Claire B. Vietri, MD (she/her/hers)
Pediatric Resident PGY-2
Seattle Children's/University of Washington
Seattle, Washington, United States
 1n (%); Median [Q1, Q3]
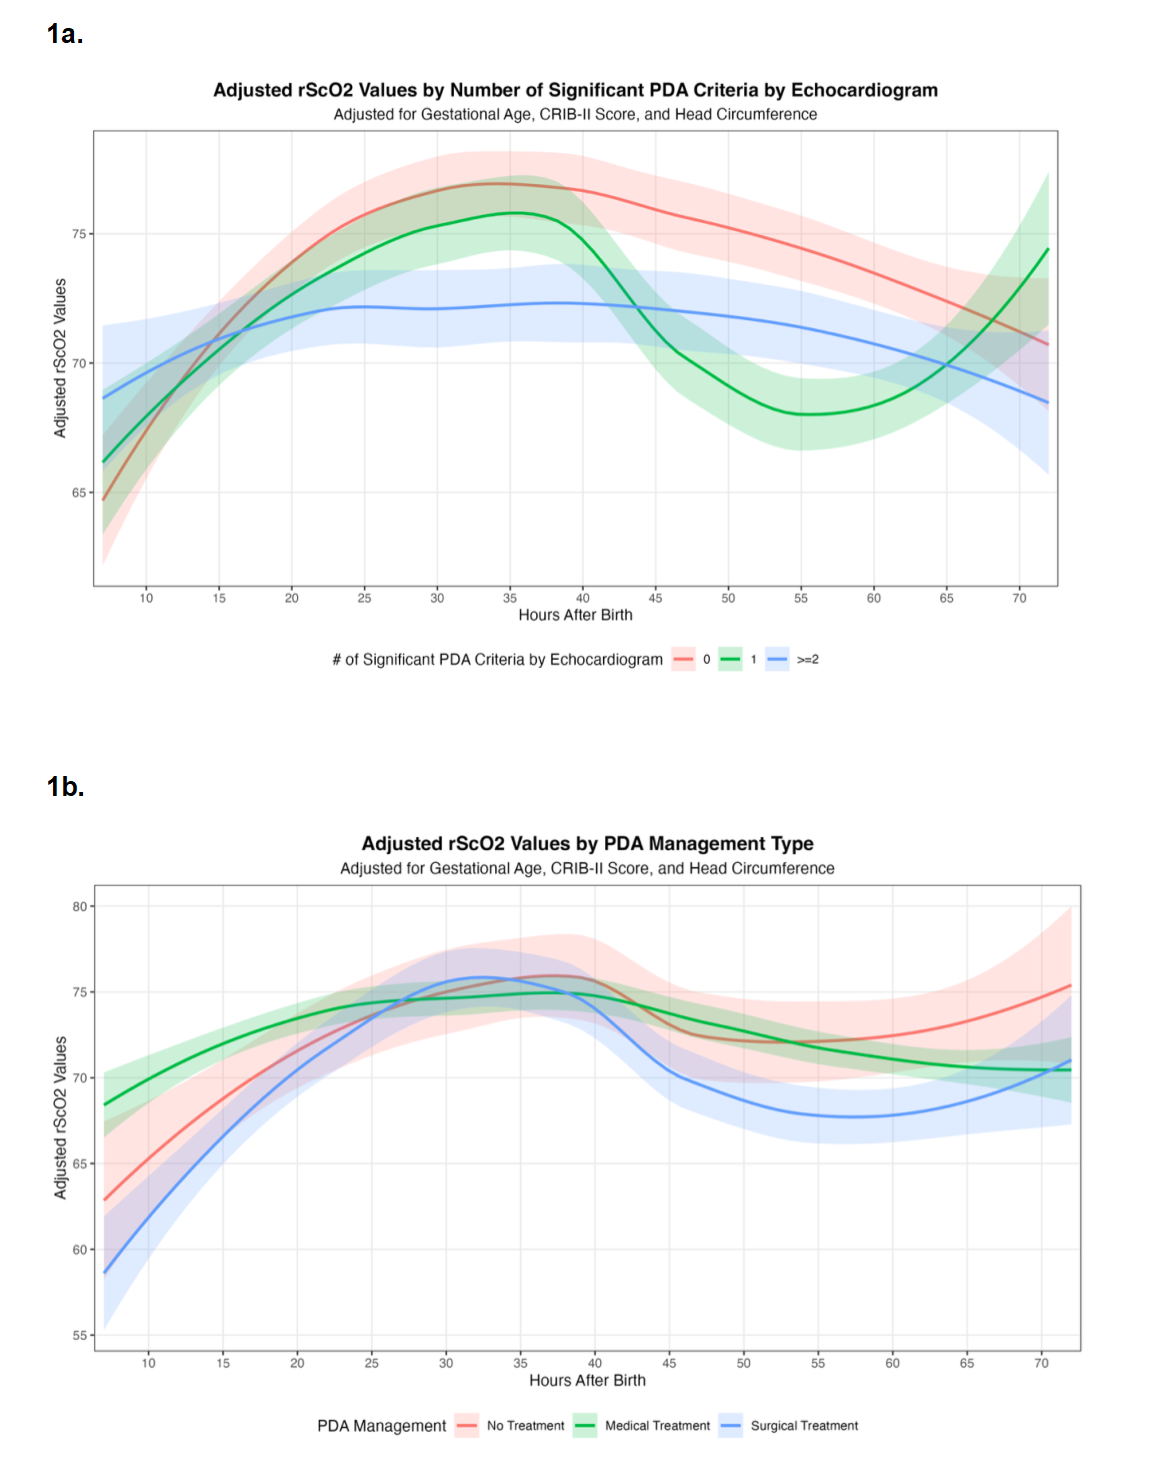 Figure 1: LOESS rScO2 curves a. Echocardiogram Criteria HsPDA: rScO2 trajectories between 6 to 72 hours after birth stratified by echocardiogram criteria for hsPDA, (0-1, or ≥ 2), adjusting for gestational age, CRIB II, and head circumference. b. Clinical Management HsPDA: rScO2 trajectories between 6 to 72 hours after birth stratified by clinical management of hsPDA (none, medical, and surgical) adjusting for gestational age, CRIB II, and head circumference.
 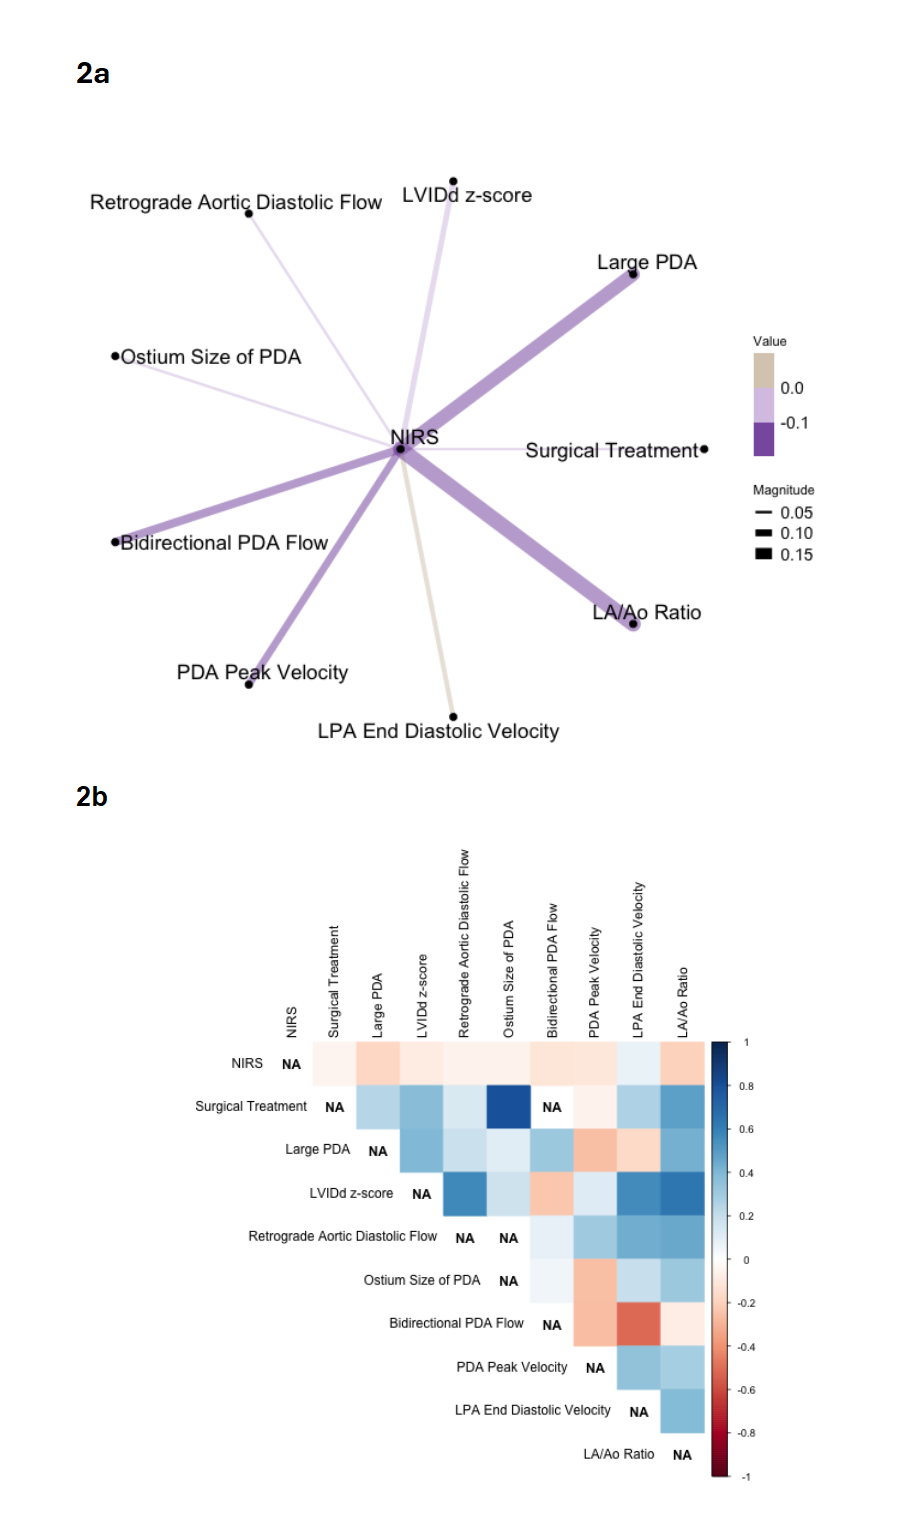 Figure 2: Relationship between NIRS (rScO2) and variables in hsPDA. 2a. Pearson Variable Graphical Analysis showing the relationship between NIRS (rScO2) and criteria of hsPDA, including: LVIDd z-score (Left Ventricular Internal Dimension at end-Diastole z-score); Large PDA, Surgical Treatment, LA/Ao Ratio, Left Atrium Diameter by Aorta Diameter Ratio); LPA End Diastolic Velocity, (Left Pulmonary Artery at End Diastolic Velocity); PDA Peak Velocity, Bidirectional PDA Flow (compared to those with left to right flow, no infants with only right to left flow), Ostium Size PDA, Retrograde Aortic Diastolic Flow. The purple lines indicate a negative association. The gold indicates a positive association. The thickness of the line corresponds to the absolute value and strength of r. b: Heat Map Relating NIRS (rScO2) and Components of the Echocardiogram. NIRS (rScO2), Surgical Treatment, Large PDA, LVIDd z-score, retrograde Aortic Diastolic Flow, Ostium Size of PDA, Bidirectional PDA Flow, PDA Peak Velocity, LPA End Diastolic Velocity, and LA/Ao Ratio, to one another. The two axes represent the variables compared, and the value of the Pearson's coefficient in each cell determines the color. Blue represents a positive relationship, while red represents a negative relationship.