
Neonatal Clinical Trials
Session: Neonatal Clinical Trials 1
 photo")
Omar Hayatt, BS,MS (he/him/his)
Research Director
Weill Cornell Medicine
New York, New York, United States
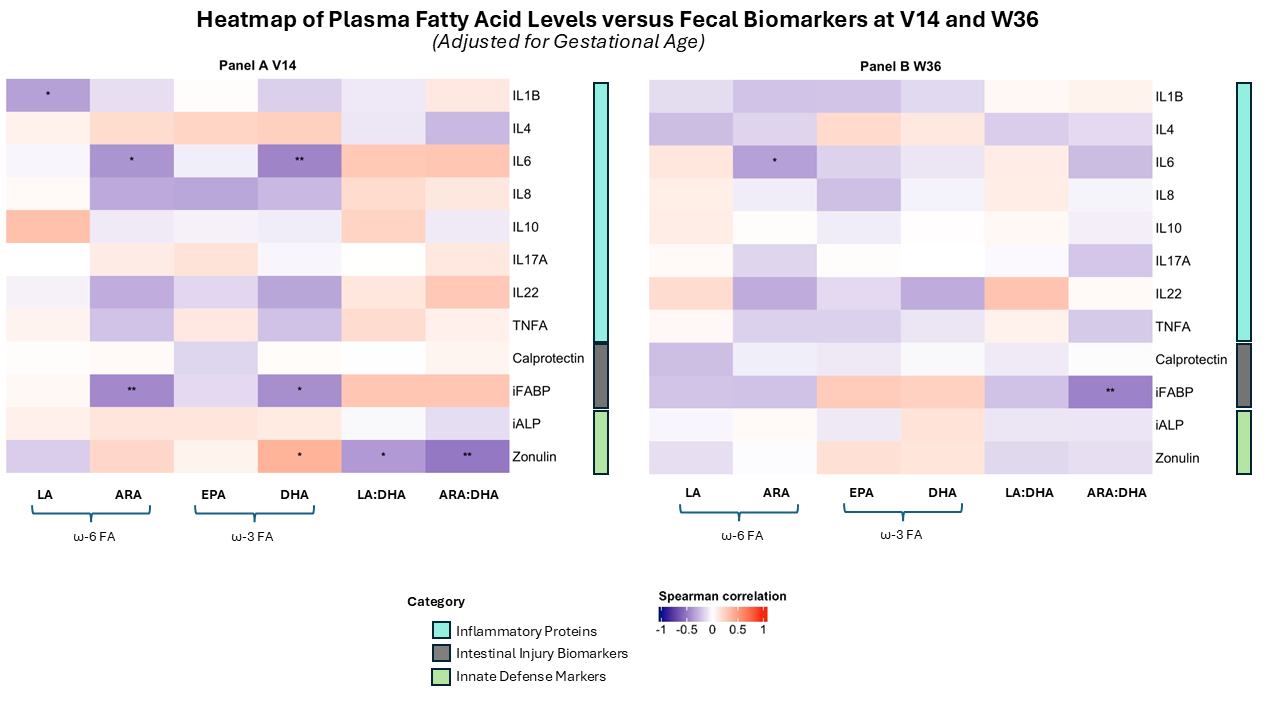 Figure 1. Heatmap showing correlations between plasma fatty acids and ratios with fecal inflammatory proteins (IL-1β, IL-4, IL-6, IL-8, IL-10, IL-17A, IL-22, TNF-α), markers of intestinal injury (calprotectin and iFABP,) and innate defense markers (iALP, zonulin) at day 14 (V14) and 36 weeks PMA (W36), adjusted for gestational age. * = p<0.05, **=p < 0.01
.png) Figure 2. Box-and-whisker plots showing fecal biomarker expression at V14 stratified by enteral DHA/ARA dose: Control: [0]mg/kg, Group 1 [360.3-747.5]mg/kg, Group 2 [747.5-863.6]mg/kg
Figure 2. Box-and-whisker plots showing fecal biomarker expression at V14 stratified by enteral DHA/ARA dose: Control: [0]mg/kg, Group 1 [360.3-747.5]mg/kg, Group 2 [747.5-863.6]mg/kg.png) Figure 3. Box-and-whisker plots showing fecal biomarker expression at W36 stratified by enteral DHA/ARA dose: Control: [0]mg/kg, Group 1 [1424.2-1895.4]mg/kg, Group 2 [1895.4-3969.3]mg/kg
Figure 3. Box-and-whisker plots showing fecal biomarker expression at W36 stratified by enteral DHA/ARA dose: Control: [0]mg/kg, Group 1 [1424.2-1895.4]mg/kg, Group 2 [1895.4-3969.3]mg/kg 