
Infectious Diseases
Session: Infectious Diseases 1: Respiratory Infections
 photo")
Xinwen Xu, MA (she/her/hers)
Clinical Research Coordinator III
Massachusetts General Hospital
Boston, Massachusetts, United States
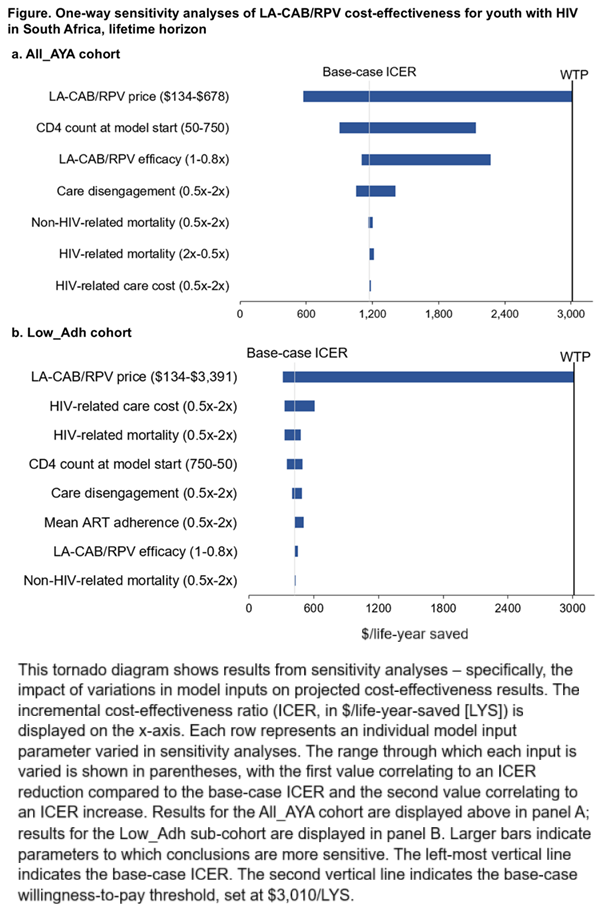 This tornado diagram shows results from sensitivity analyses - specifically, the impact of variations in model inputs on projected cost-effectiveness results. The incremental cost-effectiveness ratio (ICER, in $/life-year-saved [LYS]) is displayed on the x-axis. Each row represents an individual model input parameter varied in sensitivity analyses. The range through which each input is varied is shown in parentheses, with the first value correlating to an ICER reduction compared to the base-case ICER and the second value correlating to an ICER increase. Results for the All_AYA cohort are displayed above in panel A; results for the Low_Adh sub-cohort are displayed in panel B. Larger bars indicate parameters to which conclusions are more sensitive. The left-most vertical line indicates the base-case ICER. The second vertical line indicates the base-case willingness-to-pay threshold, set at $3,010/LYS.