
Neonatal Neurology
Session: Neonatal Neurology 5: Preterm & Neurodevelopment
Hiroyuki Kidokoro, n/a (he/him/his)
MD, PhD
Nagoya University Graduate School of Medicine
Nagoya, Aichi, Japan
.jpg) Plots depict 28-channel average functional connectivity (FC) and phase synchronization index (PSI) across active sleep (AS), quiet sleep (QS), and wakefulness (W) in 37 preterm recordings and 9 term-born recordings. In preterm infants, repeated-measures ANOVA with Bonferroni correction shows significant differences between AS and QS (P <0.001) and between QS and W (P <0.001); PSI showed the same pattern. In term infants, average FC does not differ across AS, QS, and W, whereas PSI differs significantly between AS and QS.
Plots depict 28-channel average functional connectivity (FC) and phase synchronization index (PSI) across active sleep (AS), quiet sleep (QS), and wakefulness (W) in 37 preterm recordings and 9 term-born recordings. In preterm infants, repeated-measures ANOVA with Bonferroni correction shows significant differences between AS and QS (P <0.001) and between QS and W (P <0.001); PSI showed the same pattern. In term infants, average FC does not differ across AS, QS, and W, whereas PSI differs significantly between AS and QS.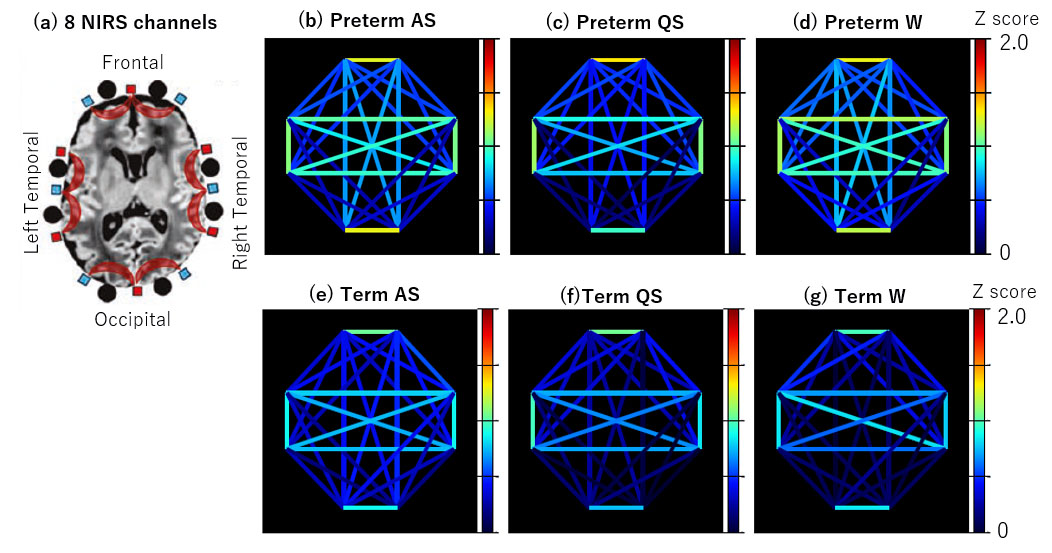 (a) Schematic of the eight-channel fNIRS probe layout. (b-d) Functional connectivity (FC) during active sleep (AS), quiet sleep (QS), and wakefulness (W) in preterm infants, respectively. (e-g) Corresponding FC maps during AS, QS, and W in term infants.
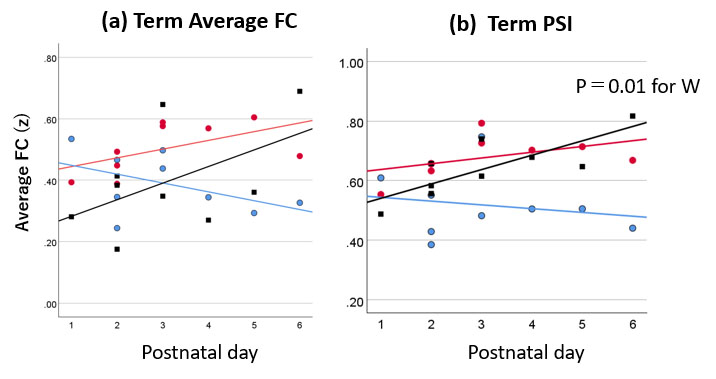 Panels (a) and (b) show the associations of average functional connectivity (FC) and phase synchronization index (PSI), respectively, with postnatal age (days). Active sleep (AS), quiet sleep (QS), and wakefulness (W) are indicated in red, blue, and black, respectively, for both scatter points and fitted trend lines.