
Environmental Health
Session: Environmental Health

 photo")
Joseph Wilson, Jr., MHS (he/him/his)
PhD Candidate
Harvard T.H. Chan School of Public Health
Cambridge, Massachusetts, United States
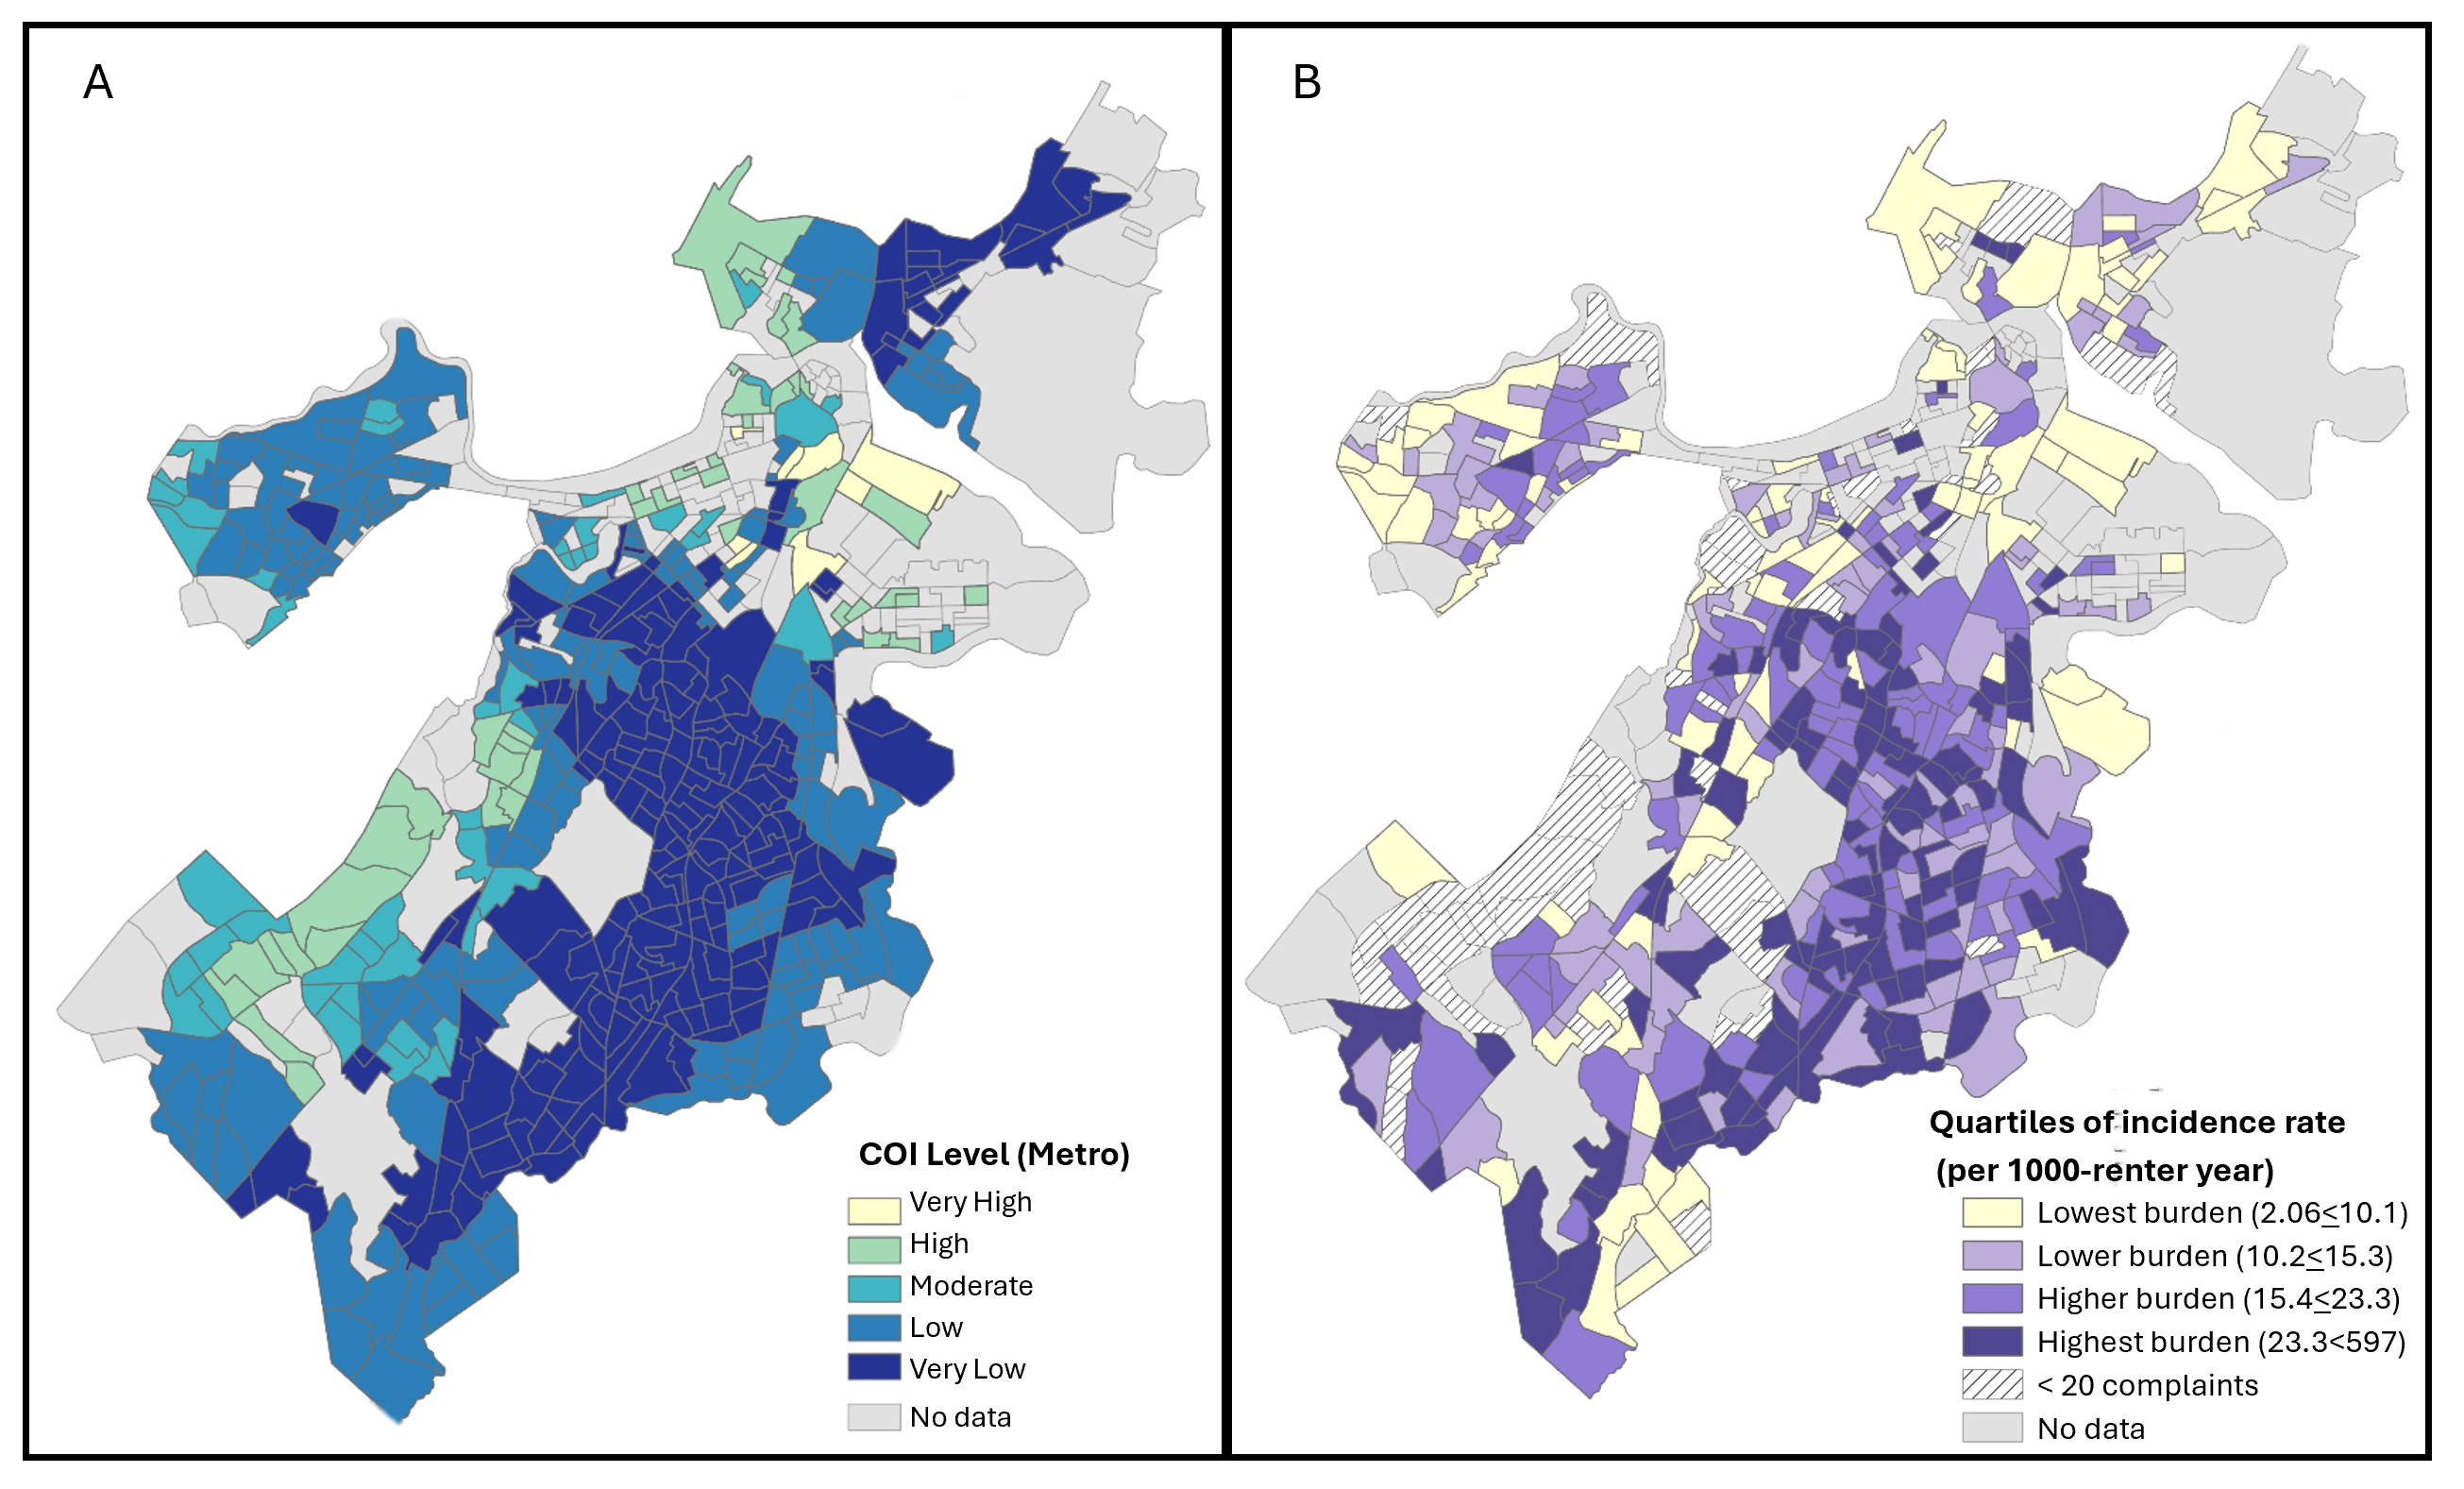 A) Metro Child Opportunity Index (COI) Level. Choropleth maps show the quintiles of the COI. Block groups are compared within the Boston-Cambridge-Newton, MA metropolitan statistical area. B) Quartiles of 311-reported housing complaints incidence rates in Boston, MA, 2017-2024. Choropleth maps show the quartiles of 311-reported housing complaints across the study population. Quartiles derived from the citywide distribution of 311 reports. Block groups with less than 10 children or less than 5 residential units are not included in the study and are included in the 'no data' category.
.png) Predictors shown reflect neighborhood-level factors. Dots indicate relative risk (approximated from the odds ratio). Horizontal lines indicate 95% confidence intervals (CI).
Predictors shown reflect neighborhood-level factors. Dots indicate relative risk (approximated from the odds ratio). Horizontal lines indicate 95% confidence intervals (CI). 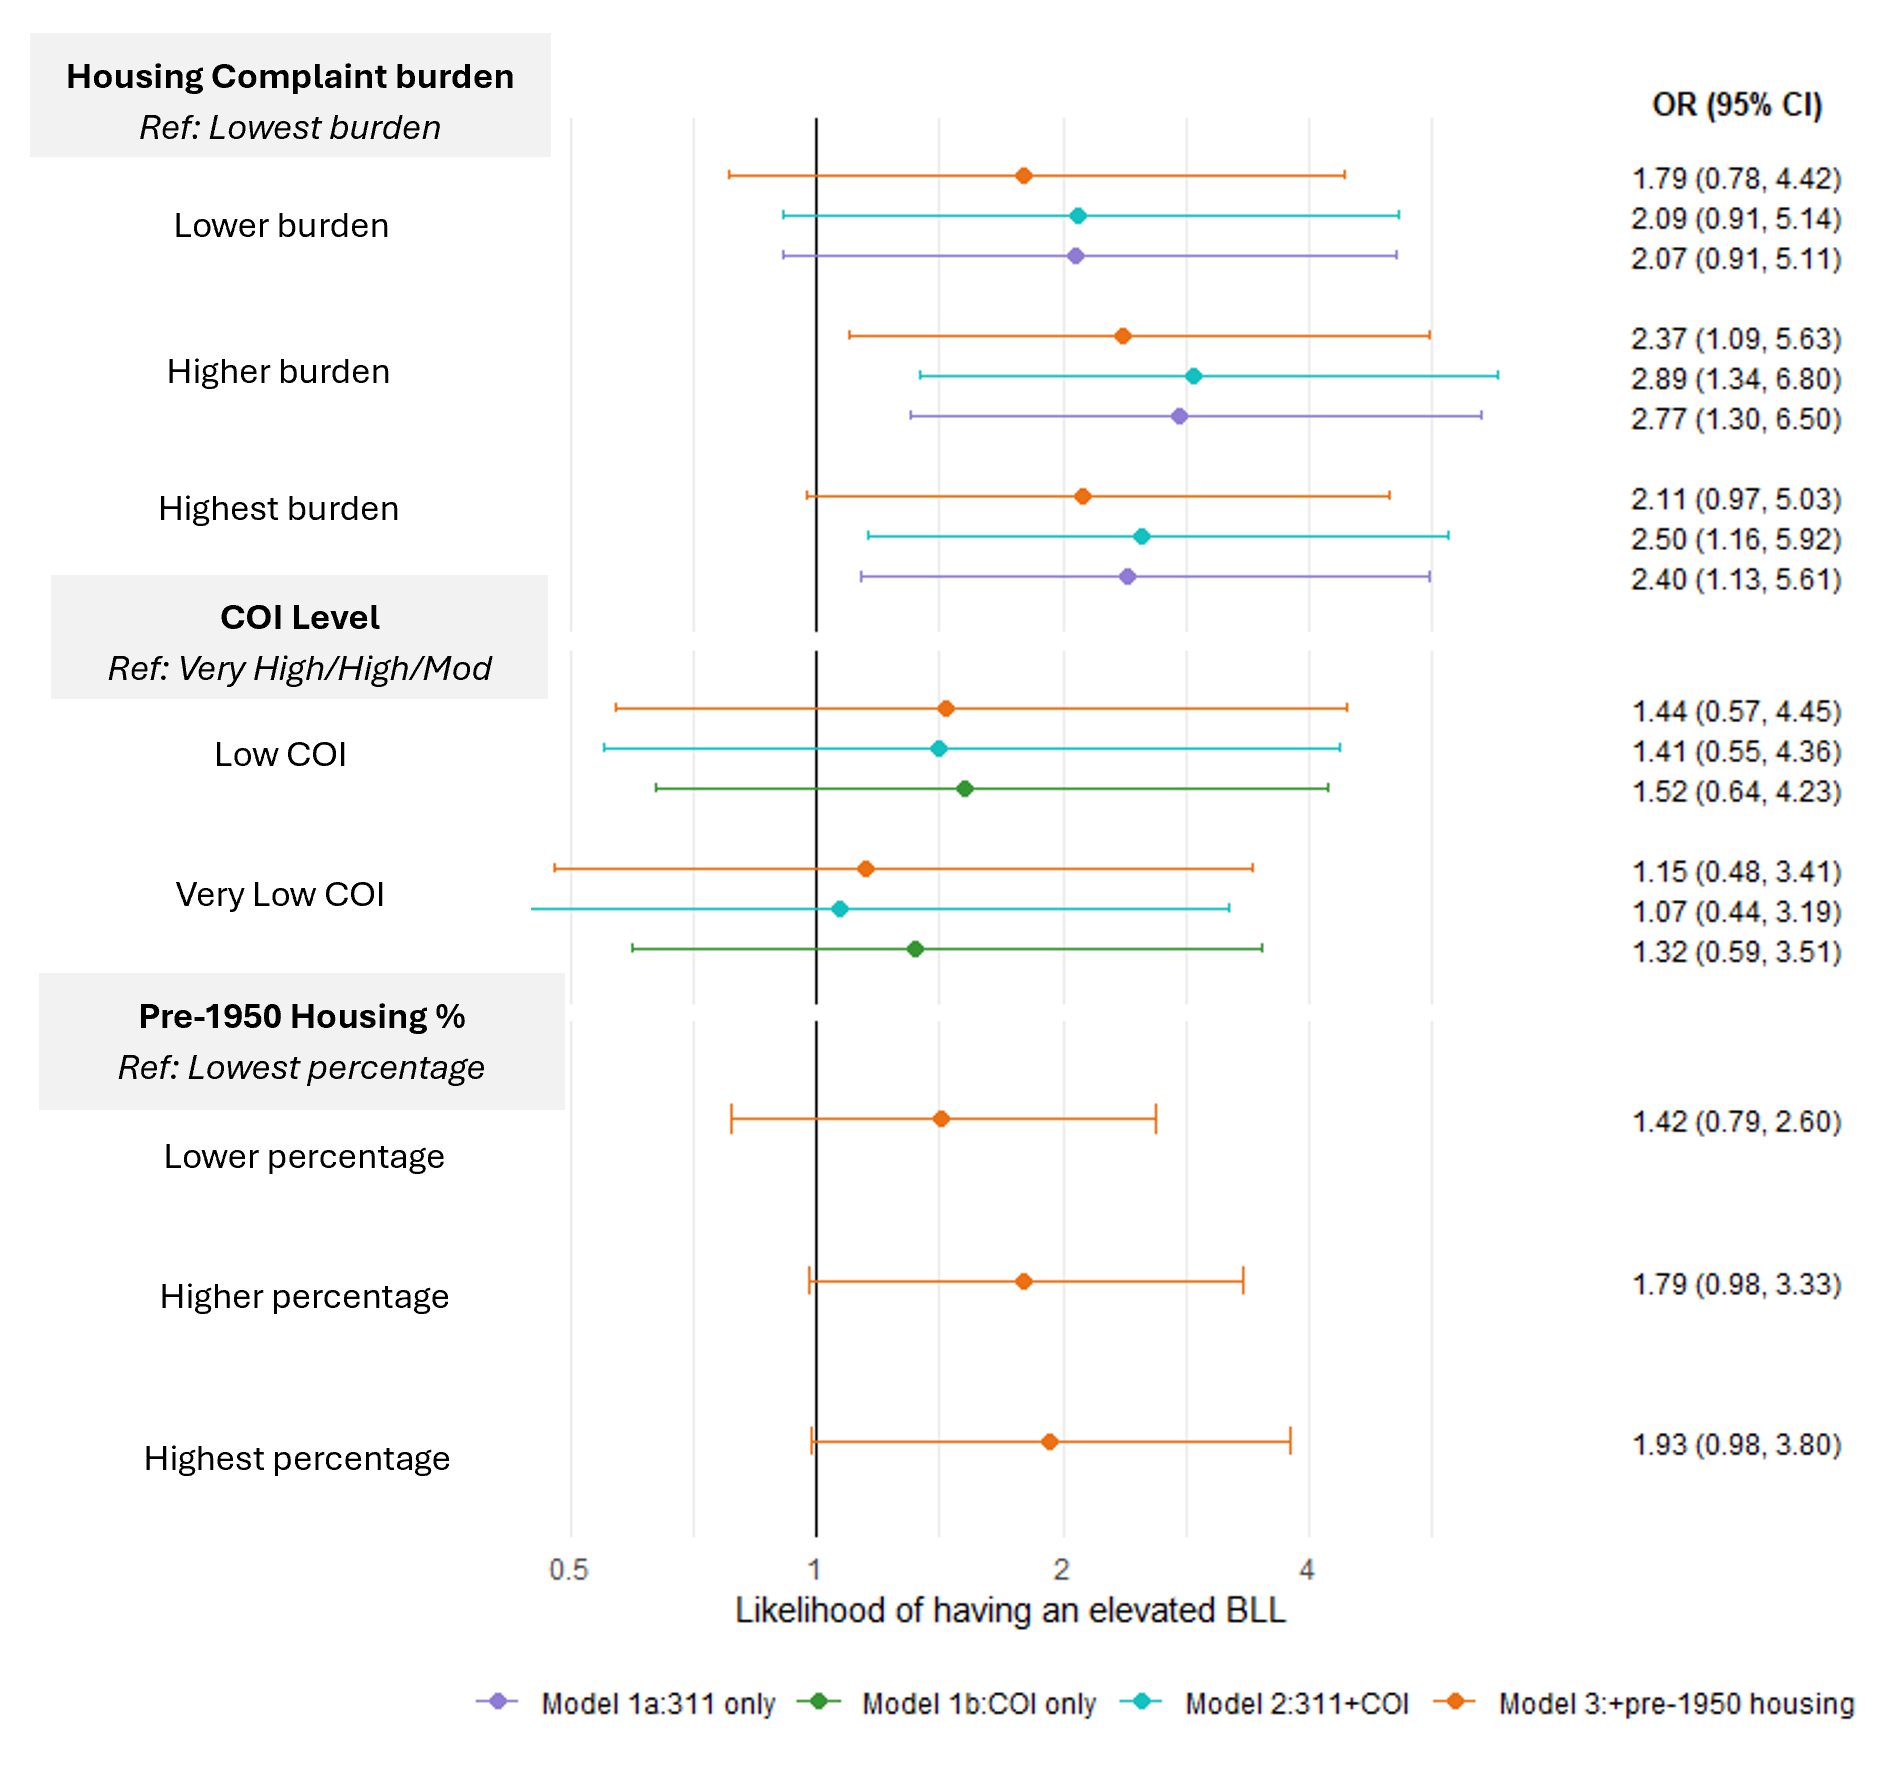 Dots indicate relative risk (approximated from the odds ratio). Horizontal lines indicate 95% confidence intervals (CI).