
Neonatal Fetal Nutrition & Metabolism
Session: Neonatal Fetal Nutrition & Metabolism 4

Emily R. Sullivan, Student
Medical Student
Rush Medical College of Rush University Medical Center
Cortlandt Manor, New York, United States
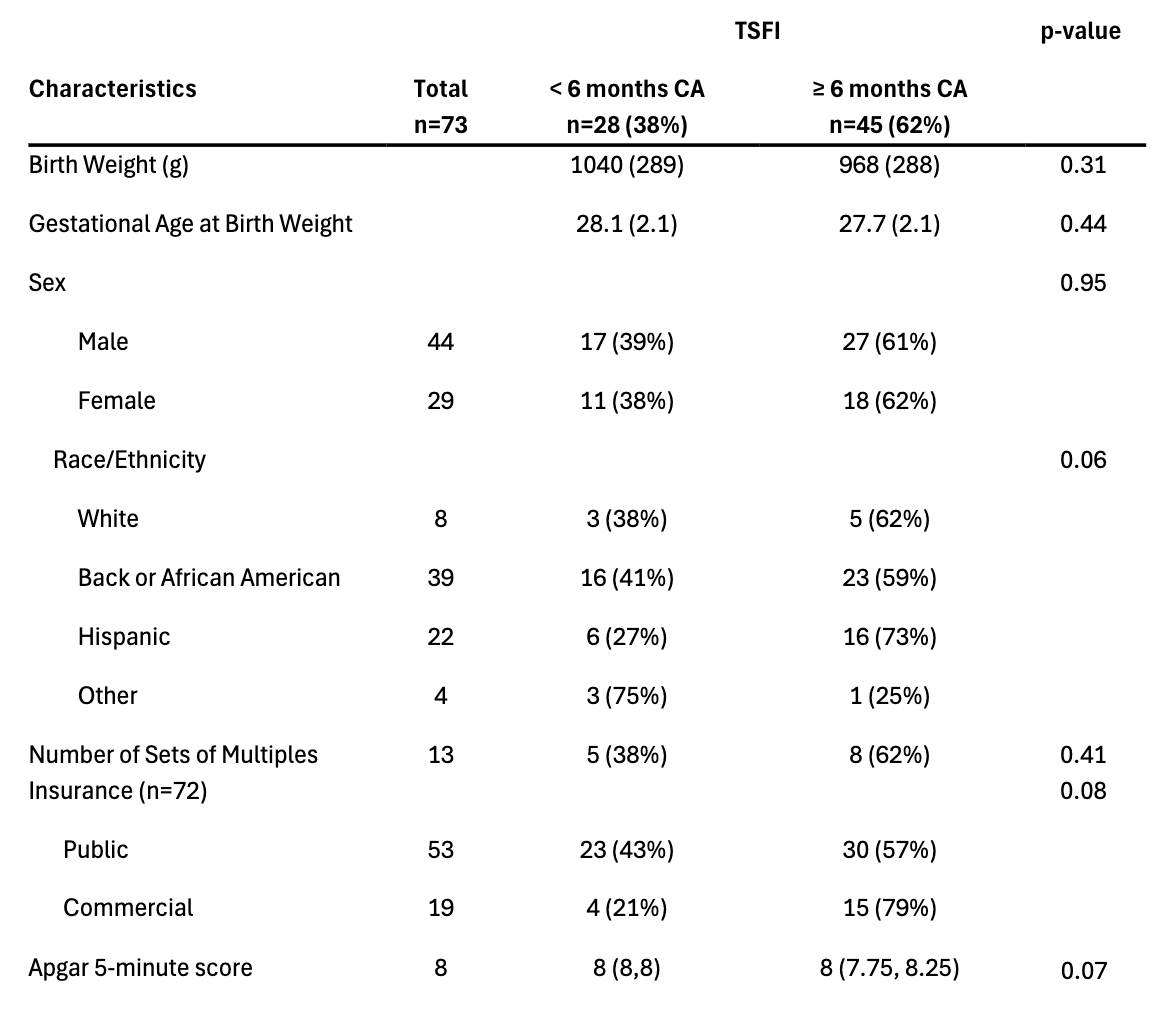 Data are presented as mean (standard deviation), or median (interquartile range) for continuous variables and n (%) for categorical variables. P-values represent comparisons between infants <6 months and ≥6 months corrected age (CA), calculated using independent t-tests, Mann-Whitney U test, or chi-square tests, as appropriate.
 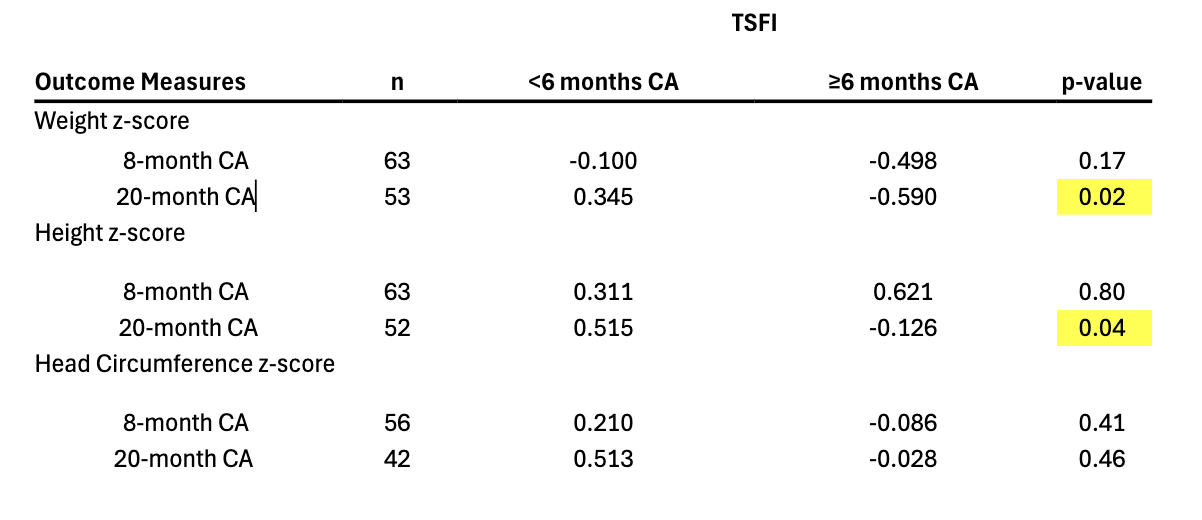 Mean z-scores of growth parameters at 8- and 20-month corrected age (CA) are reported. P values are obtained from independent t-tests of comparing means between the two TSFI groups ( <6 months and ≥ 6 months) at each time point. Significance is indicated with yellow highlights. (n) is the sample size, the number of participants with available growth measurements at the corresponding visit.
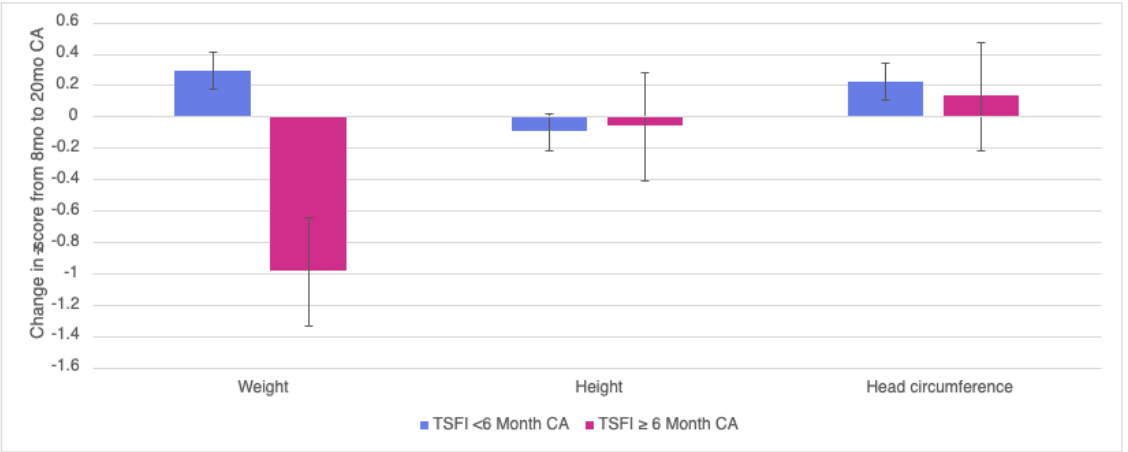 Change in growth z-scores between 8 and 20 months corrected age among infants with both timepoints available, stratified by timing of solid food introduction (TSFI). For infants introduced to solids 6 months before corrected age ( <6mo CA) length n = 21, weight n = 20, and head circumference n = 14. For those introduced to solids after 6 months corrected age (≥ 6mo CA) length n = 23, weight n = 20, and head circumference n = 18.