
Neonatal Fetal Nutrition & Metabolism
Session: Neonatal Fetal Nutrition & Metabolism 4

Ellen Ingolfsland, MD
Assistant Professor
University of Minnesota
Minneapolis, Minnesota, United States
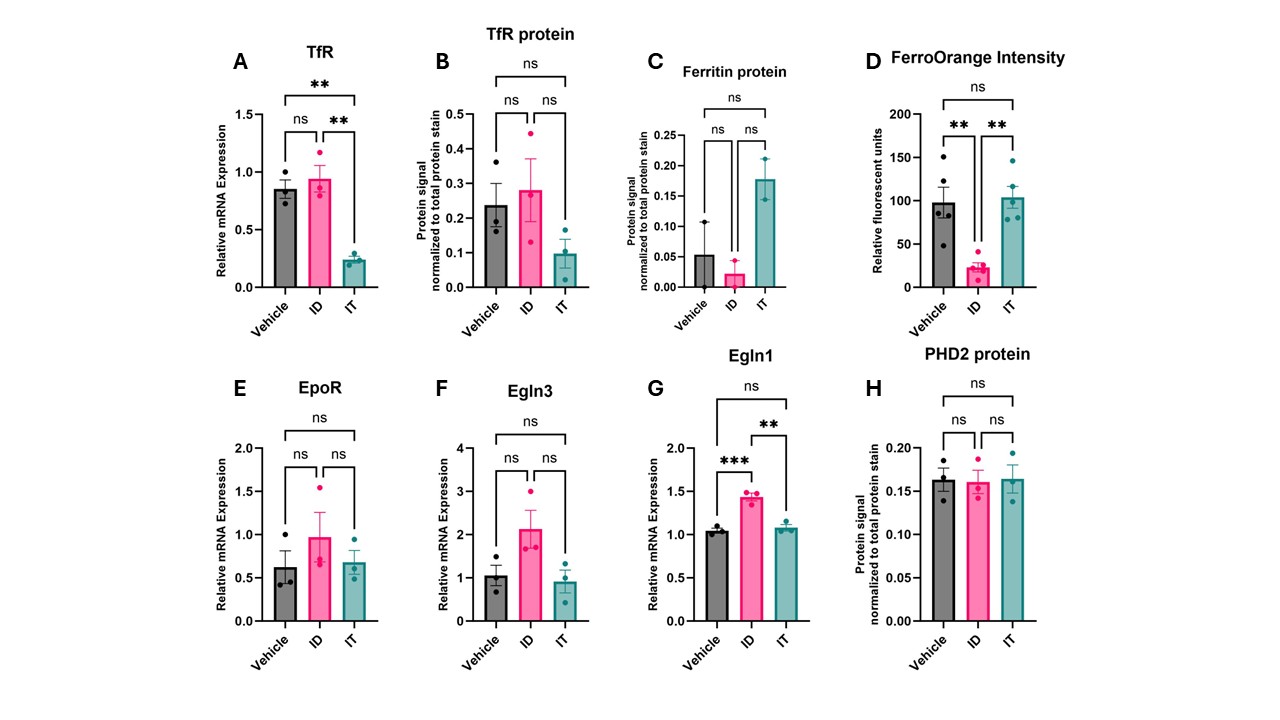 Iron status as indicated by transferrin receptor (TfR) A) mRNA expression by qPCR and B) protein level by western blot, C) ferritin protein by western blot, and D) FerroOrange intensity. Angiogenic markers E) erythropoietin receptor (EpoR), F) prolyl hydroxylase domain (PHD) containing (Egln) 3, and G) Egln1 mRNA expression by qPCR and by H) PHD protein level by Western blot. ** signifies < 0.01.
 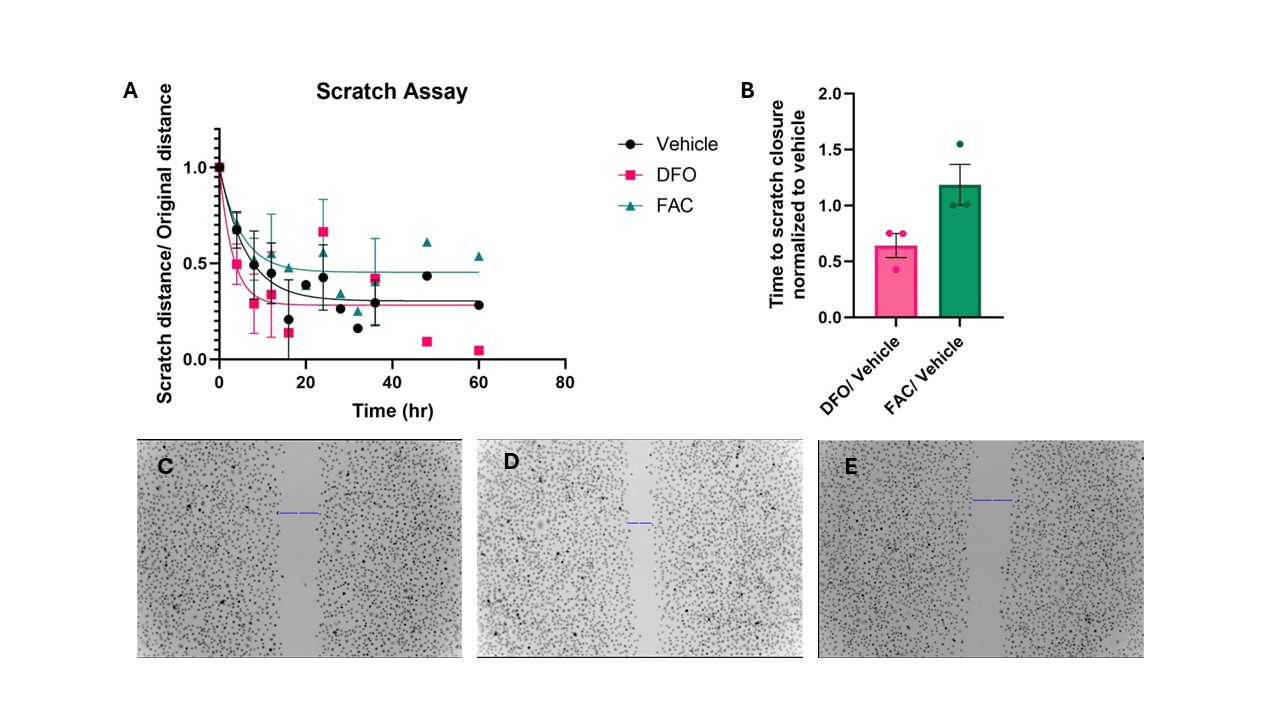 A) Linear regression model of scratch assay by treatment group, shown as scratch distance/ original scratch distance. B) Time to scratch closure by treatment group normalized to vehicle (p=0.06). C-E) Representative images of scratch assay under treatment with C) Vehicle, D) DFO, and E) FAC.