
Neonatal-Perinatal Health Care Delivery
Session: Neo-Perinatal Health Care Delivery: Epidemiology/Health Services Research 3
 photo")
Samarchitha Magal, MD (she/her/hers)
Fellow
McGovern Medical School at UTHealth Houston
Houston, Texas, United States
.png) Demographic characteristics of women evaluated at our Fetal Center for prenatal MMC repair and women who delivered a liveborn infant with MMC in the state of Texas between 2012-2023. SVI is divided into four quartiles, grading counties from lowest (Q1) to highest (Q4) vulnerability; socioeconomic status (SES) is estimated from SVI, with lower vulnerability (Q1) approximating higher SES. 25 patients from the CMHH cohort and 20 patients from the statewide cohort were excluded from SVI calculations due to missing county information. The percentages in parentheses report the proportion of that value compared to the total number of patients in that column.
Demographic characteristics of women evaluated at our Fetal Center for prenatal MMC repair and women who delivered a liveborn infant with MMC in the state of Texas between 2012-2023. SVI is divided into four quartiles, grading counties from lowest (Q1) to highest (Q4) vulnerability; socioeconomic status (SES) is estimated from SVI, with lower vulnerability (Q1) approximating higher SES. 25 patients from the CMHH cohort and 20 patients from the statewide cohort were excluded from SVI calculations due to missing county information. The percentages in parentheses report the proportion of that value compared to the total number of patients in that column.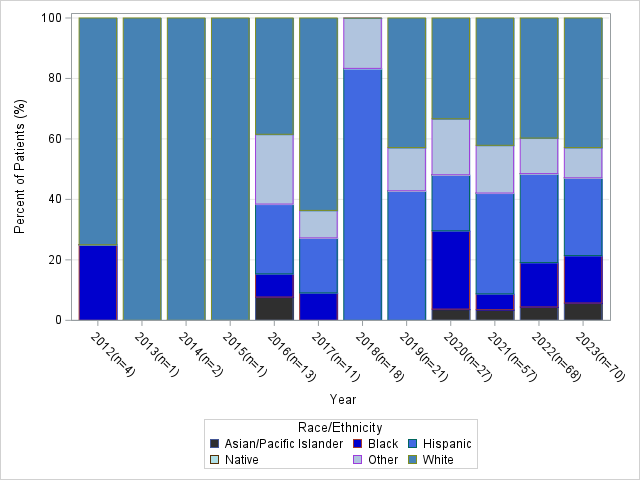 Distribution of race and ethnicity of patients evaluated at our fetal center for prenatal MMC repair between 2012-2023. Race and ethnicity are grouped in mutually exclusive groups (Hispanic of any race grouped as Hispanic, White Non-Hispanic as White, Black Non-Hispanic as Black, American Indian/Eskimo/Aleut as Native). Number of patients and heterogeneity of race/ethnicity per year increases as time goes on.
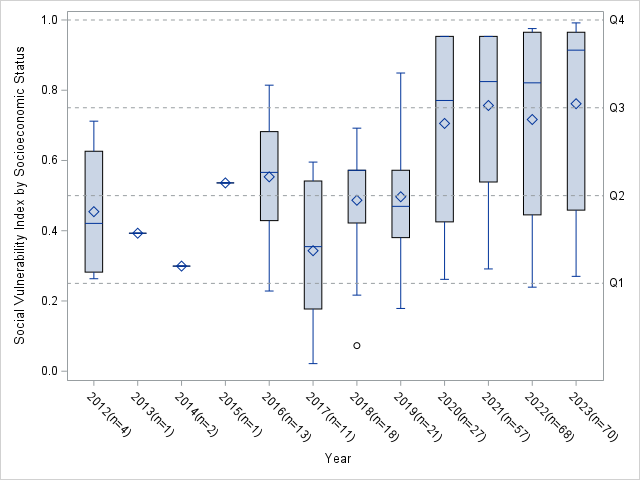 Box-and-whisker plot showing distribution by year of socioeconomic social vulnerability index (SVI) of patients evaluated at our fetal center for prenatal MMC repair between 2012-2023. SVI is estimated by patient county, 25 patients were excluded due to missing county information. Boxes indicate the 25th-75th percentile (interquartile range), horizontal lines represent the median, diamonds represents the mean, and whiskers show the range of non-outlier values. Increased spread of SVI and a trend towards higher vulnerability (lower socioeconomic status) is noted as time goes on.