
Neonatal Quality Improvement
Session: Neonatal Quality Improvement 7
 Credit")
 photo")
Anola Stage, MD, IBCLC (she/her/hers)
Neonatal-Perinatal Fellow
Children's National Health System
Washington, District of Columbia, United States
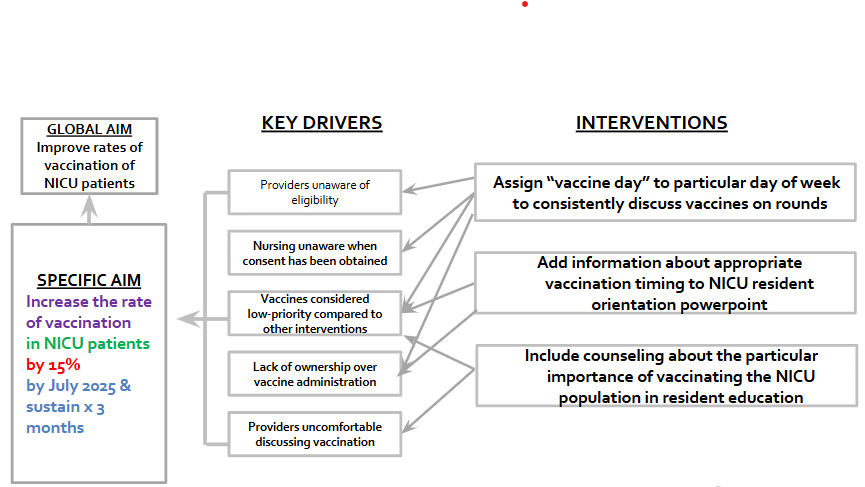 Fig. 1: Key driver diagram demonstrating barriers to on-time vaccination that we aimed to address with our PDSA cycles.
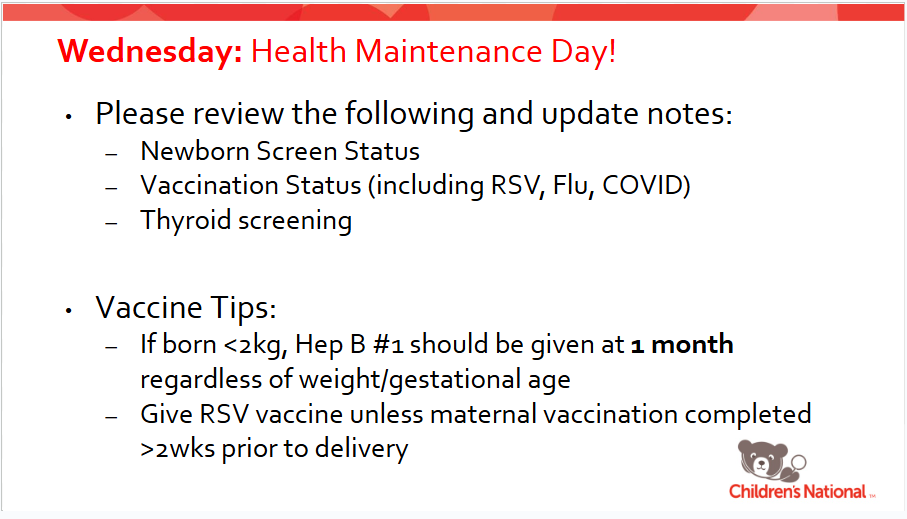 Fig. 2: Flyer placed in fellow, resident, and advanced practice provider workrooms reinforcing the implementation of "Health Maintenance Wednesday" to promote regular discussion of vaccination status.
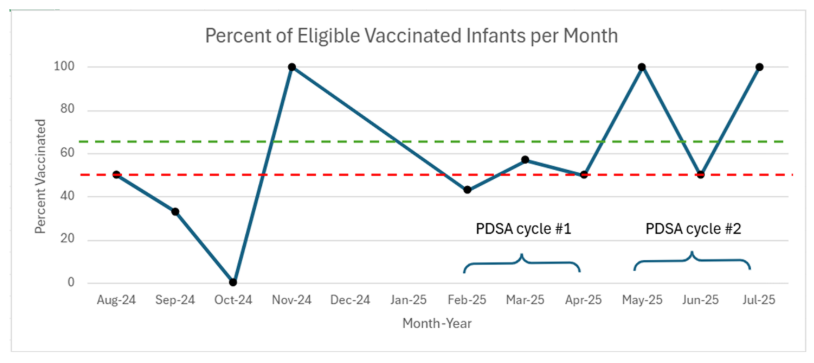 Fig. 3: Run chart demonstrating baseline vaccination rate and rates during PDSA cycles #1 and #2. The red dotted line represents the baseline unit-wide vaccination rate of 50%. The green dotted line represents the goal rate of 65% for our project.