
Neonatal Neurology
Session: Neonatal Neurology 9: Pre-Clinical 1
 photo")
Anna C. Bitners, MD (she/her/hers)
Fellow, Neonatal-Perinatal Medicine
Johns Hopkins Children's Center
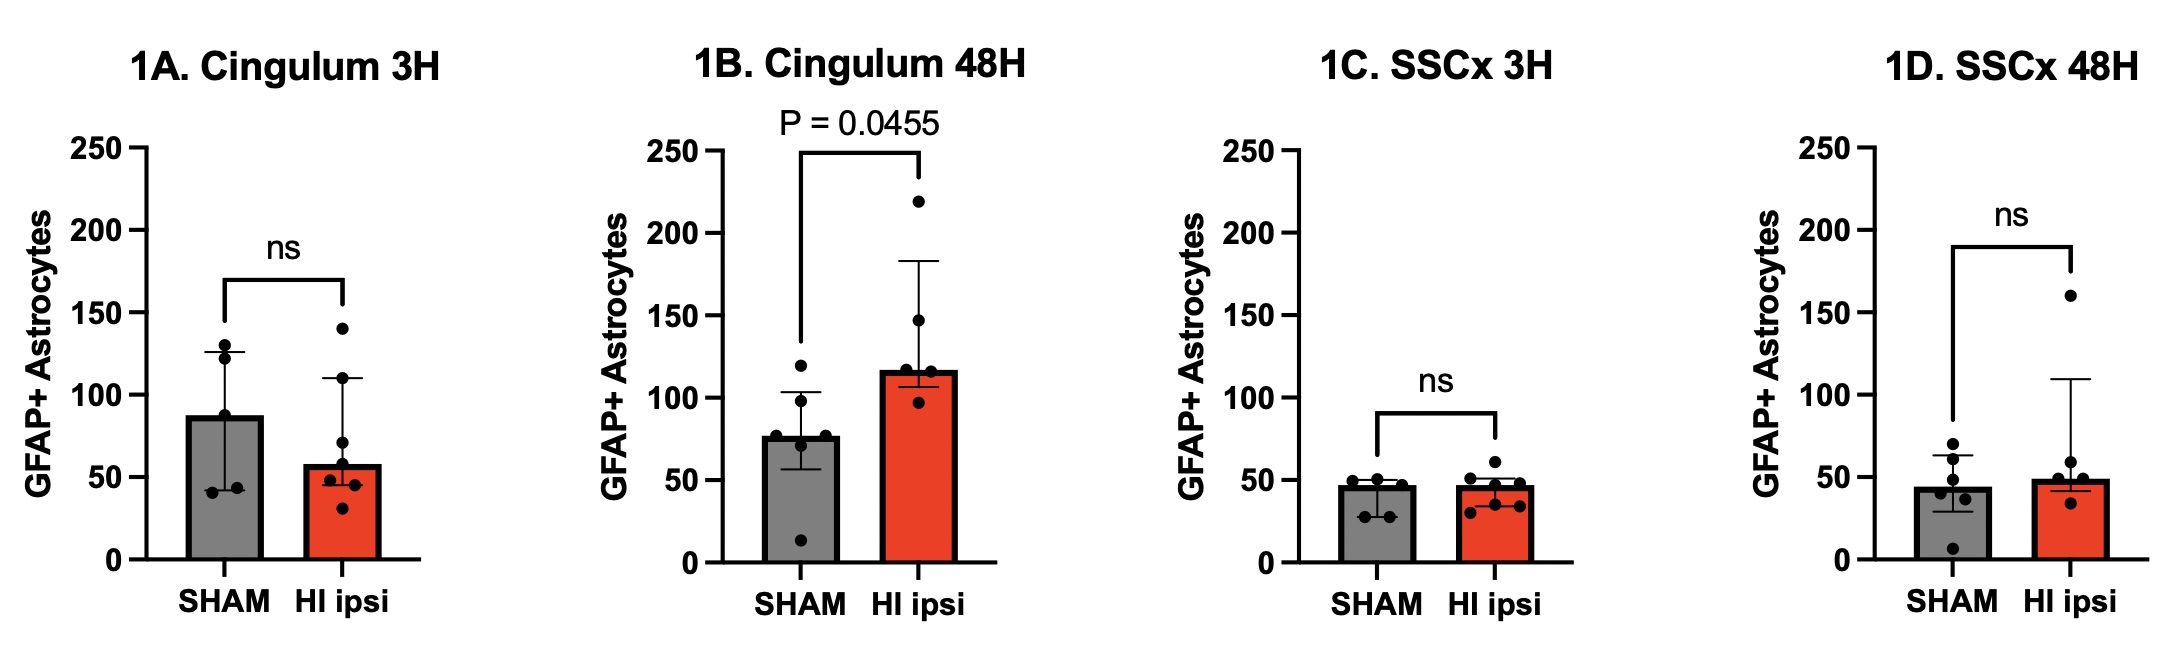 Graphs showing number of GFAP+ astrocytes stratified by region (1A,B cingulum or 1C,D somatosensory cortex [SSCx}) and time point (3 hours or 48 hours) in sham vs hypoxic ischemia (HI) groups. Data presented as median with error bars indicating interquartile range.
 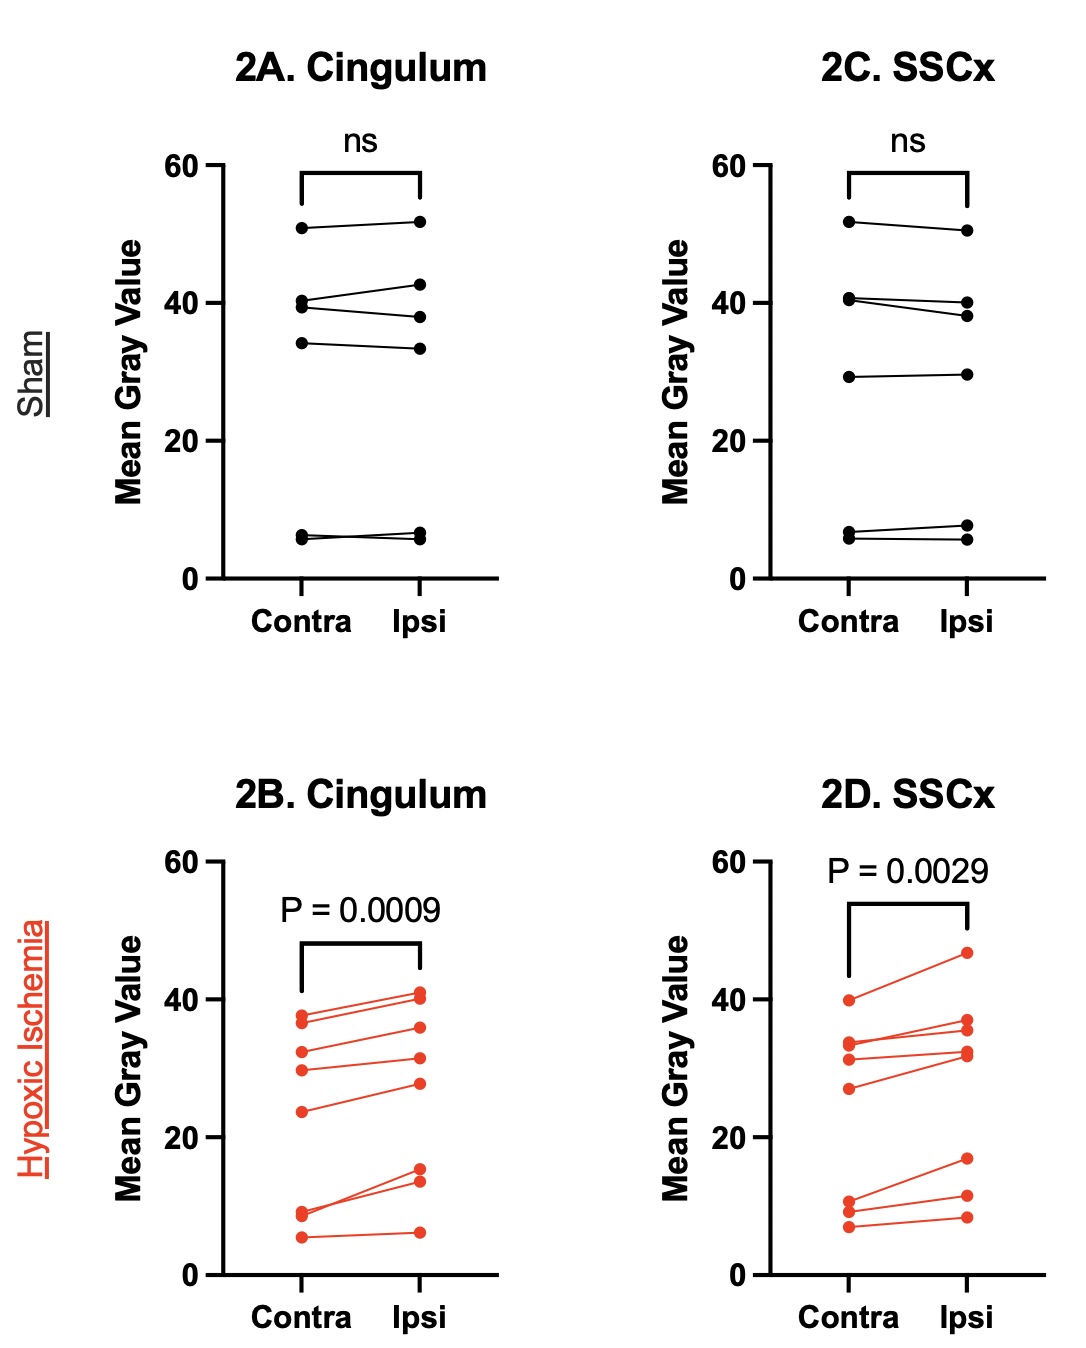 Slope chart showing mean gray value of aquaporin-4 immunofluorescence of paired cortical regions (2A,B cingulum, 2C,D somatosensory cortex [SSCx]) contralateral (contra) and ipsilateral (ipsi) to the hypoxic ischemia (HI) insult at 48 hours post-HI.
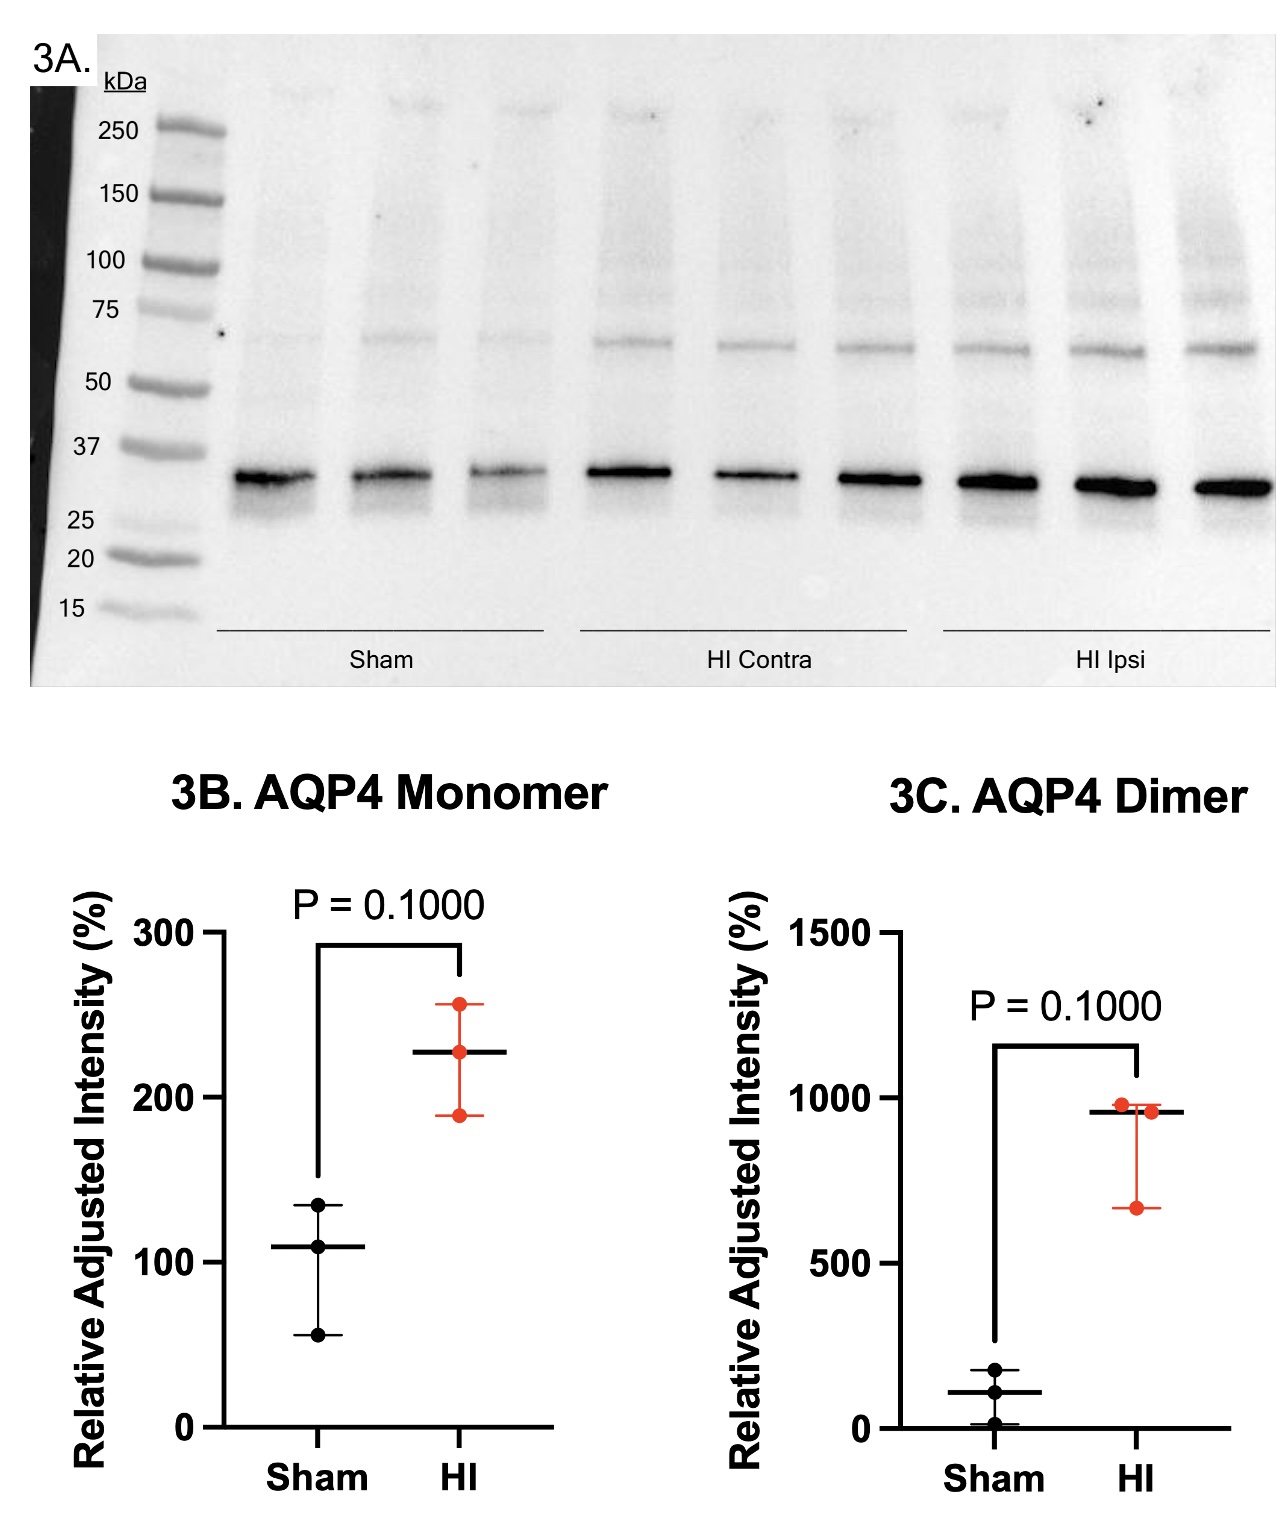 3A Western blot for AQP4 in sham, HI Contra, and HI Ipsi cortical homogenates. 3B,C Scatter plot displaying relative adjusted intensity values comparing shams to hypoxic ischemia (HI) brains ipsilateral (ipsi) to the injury. Relative adjusted intensity values of the bands of interest (3B 35 kDa, 3C 70 kDa) were calculated as a percent of the average mean grey value in sham tissue. Data are presented as median with error bars indicating interquartile range.