
Genomics/Epigenomics
Session: Genomics/Epigenomics 1

Michael A. Willcockson, MD PhD
Neonatology Fellow
Childrens Hospital of Philadelphia
Philadelphia, Pennsylvania, United States
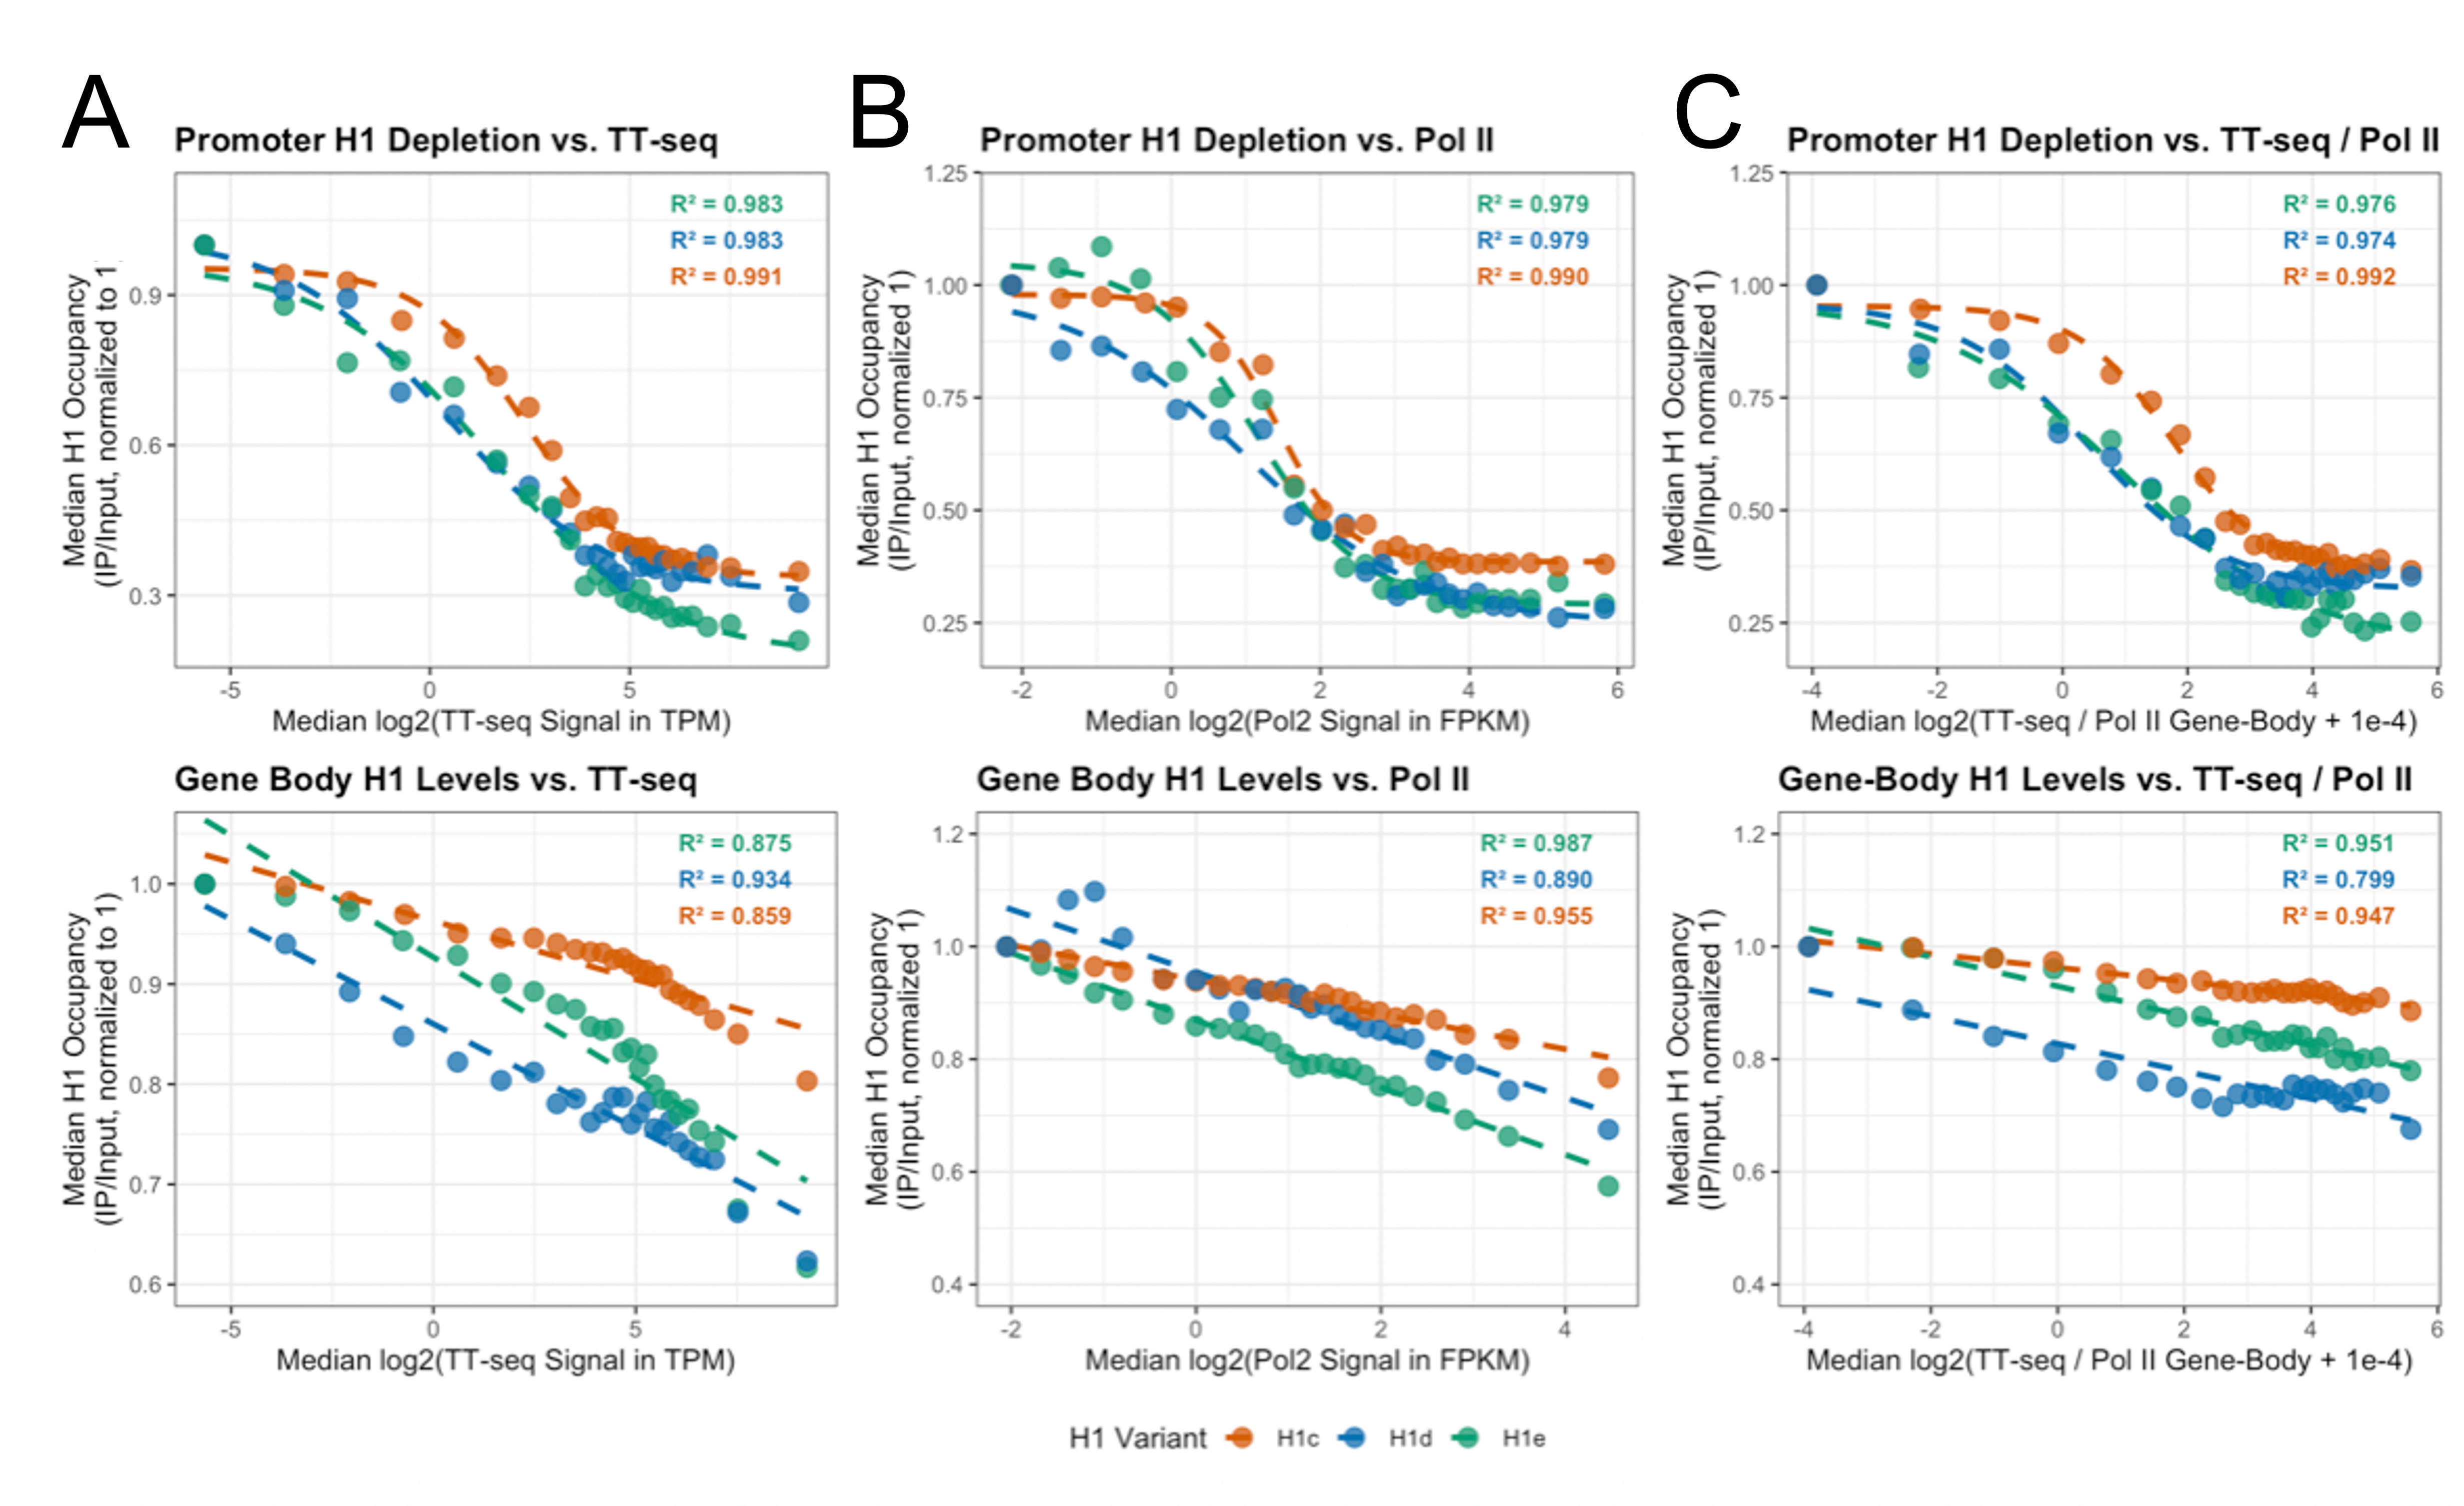 Using FKBP-2×HA H1c, H1d and H1e reporter lines (Fig. 1), we mapped H1 occupancy by ChIP-seq (IP/Input; N=2 for each H1 subtype). (A) Genes were sorted by TT-seq signal (nascent RNA output) and divided into 25 equal-sized groups from lowest to highest; each point is one group, and the y-value is the median H1 signal for that group within promoters (top) or gene bodies (bottom). Within this panel, H1 was rescaled so the lowest-TT-seq group (inactive) = 1.0. (B) Genes were sorted by Pol II ChIP-seq signal (polymerase occupancy) and divided into 25 groups; H1 values were rescaled so the lowest-Pol-II group = 1.0. (C) Genes were sorted by TT-seq/Pol II (an approximation of per-polymerase productivity) and divided into 25 groups; H1 values were rescaled so the lowest-productivity group = 1.0. Across all panels, greater transcriptional activity or productivity corresponds to lower H1, yielding strong inverse trends for H1c, H1d, and H1e (colors per legend). TT-seq and Pol II ChIP-seq: GEO GSE264584 (Aboreden et al., Mol Cell, 2025).
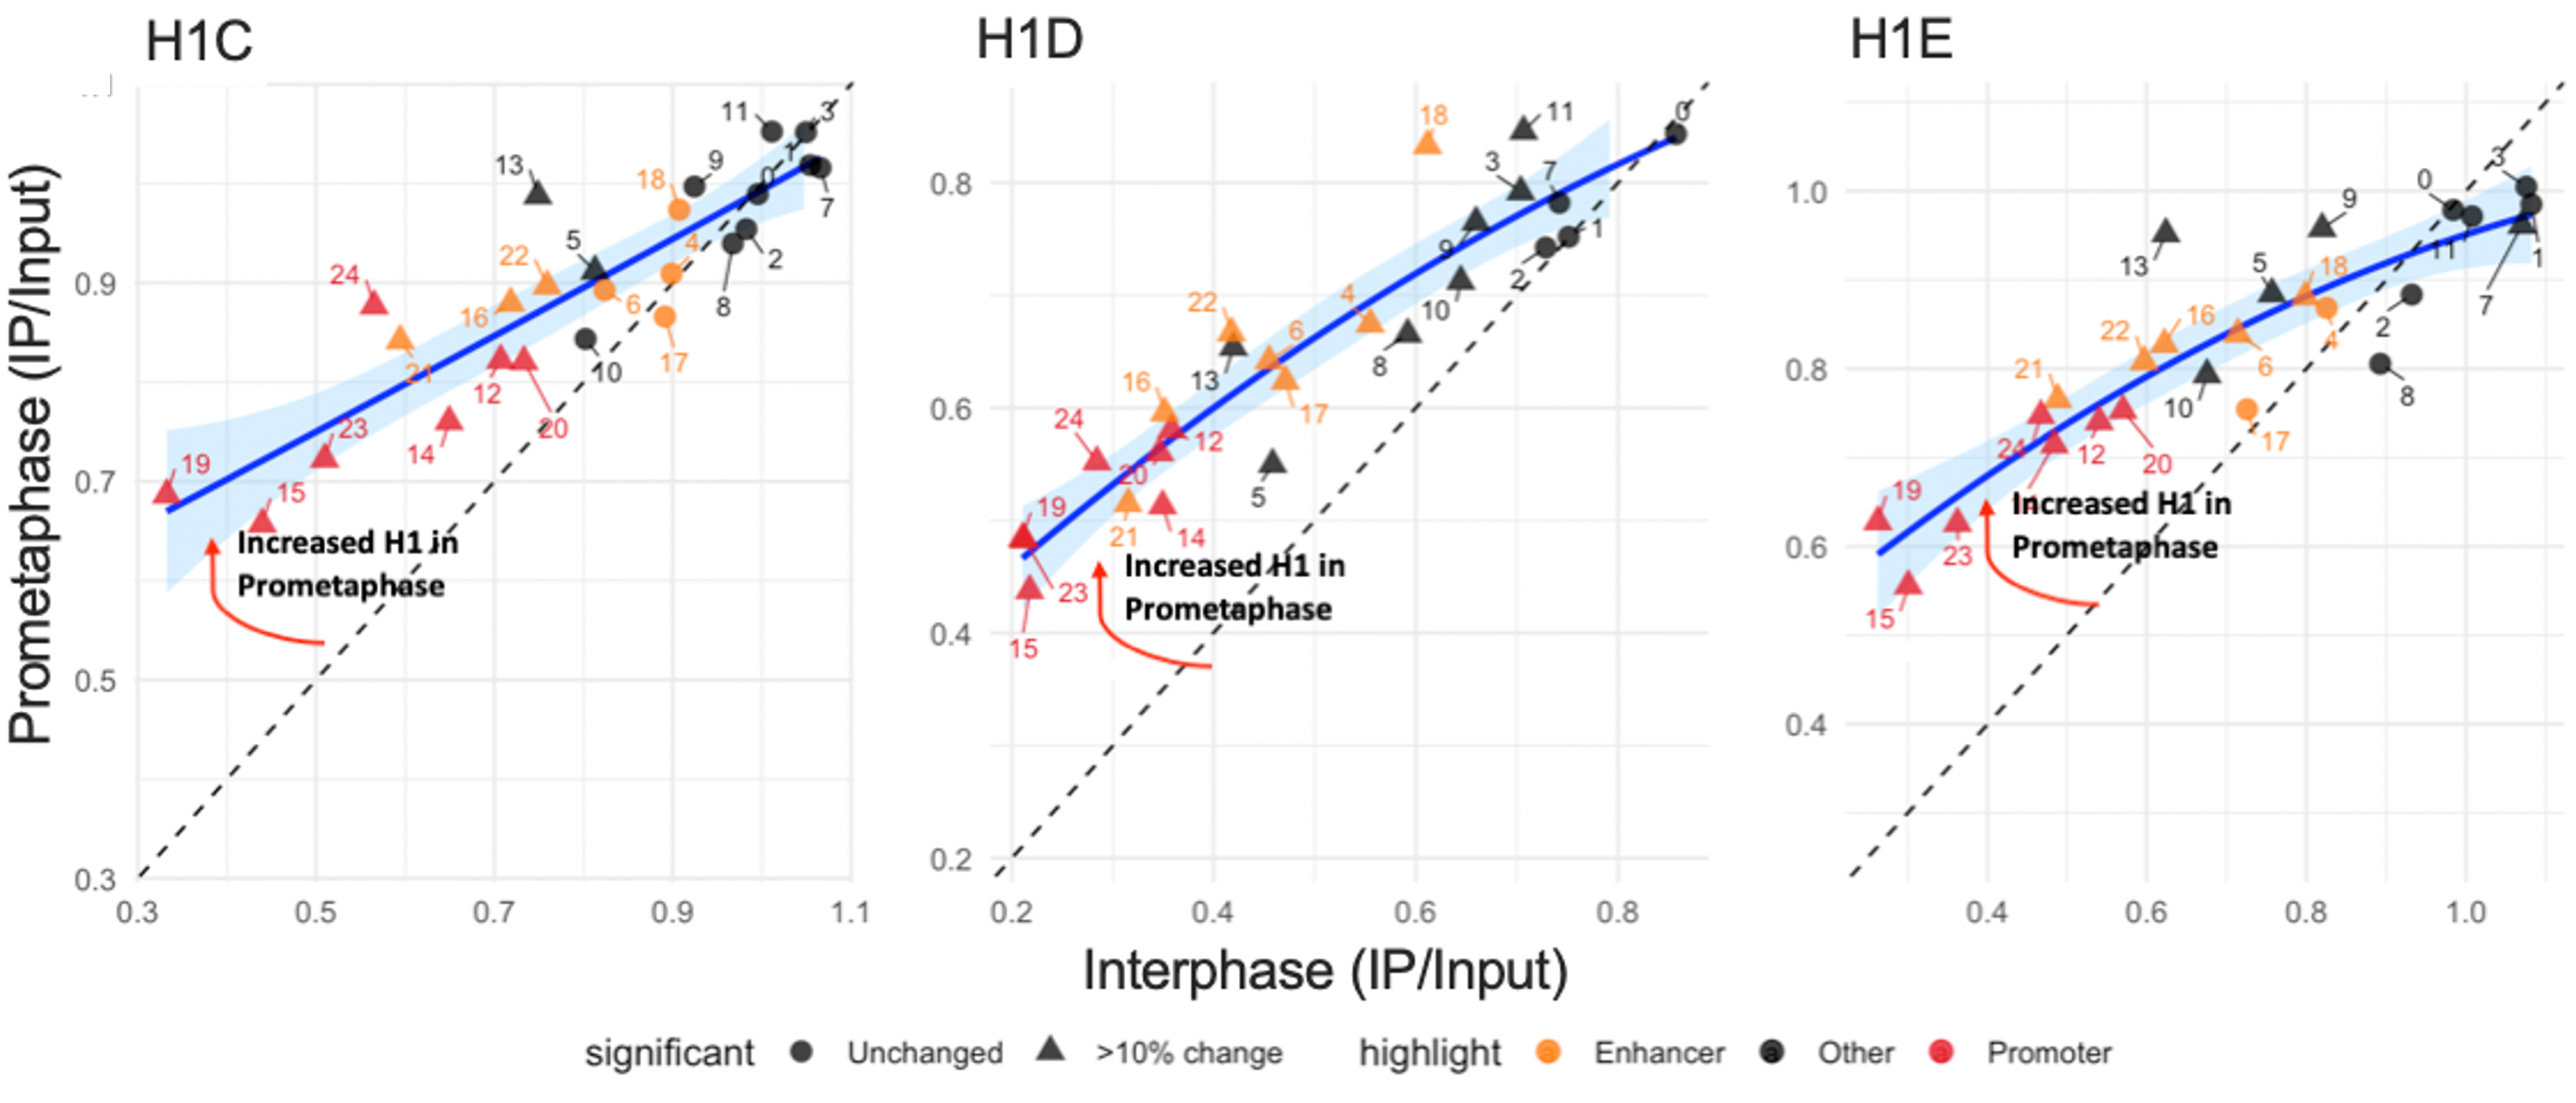 Endogenous FKBP-2×HA H1c, H1d and H1e reporter lines were profiled by ChIP-seq (IP/Input) in interphase and prometaphase G1E-ER4 cells (N=2 for each H1 subtype within each phase of the cell cycle). Prometaphase cells were enriched by nocodazole arrest and FACS using DNA content, MPM-2 (phospho-Ser/Thr-Pro) positivity, and an mCherry mitotic reporter (Zhang et al., Nature, 2019). Each panel (H1c, H1d, H1e) plots prometaphase H1 (y-axis) versus interphase H1 (x-axis) for chromatin-state bins (numbers label states); red triangles = promoters, orange triangles = enhancers, gray/black circles = other states. The dashed diagonal marks no change; the blue curve is a smoothed fit with 95% CI. Promoter and enhancer bins lie above the identity line, indicating higher H1 in prometaphase, consistent with reduced depletion of H1 at active regulatory elements during mitosis when Pol II is broadly displaced from chromatin.
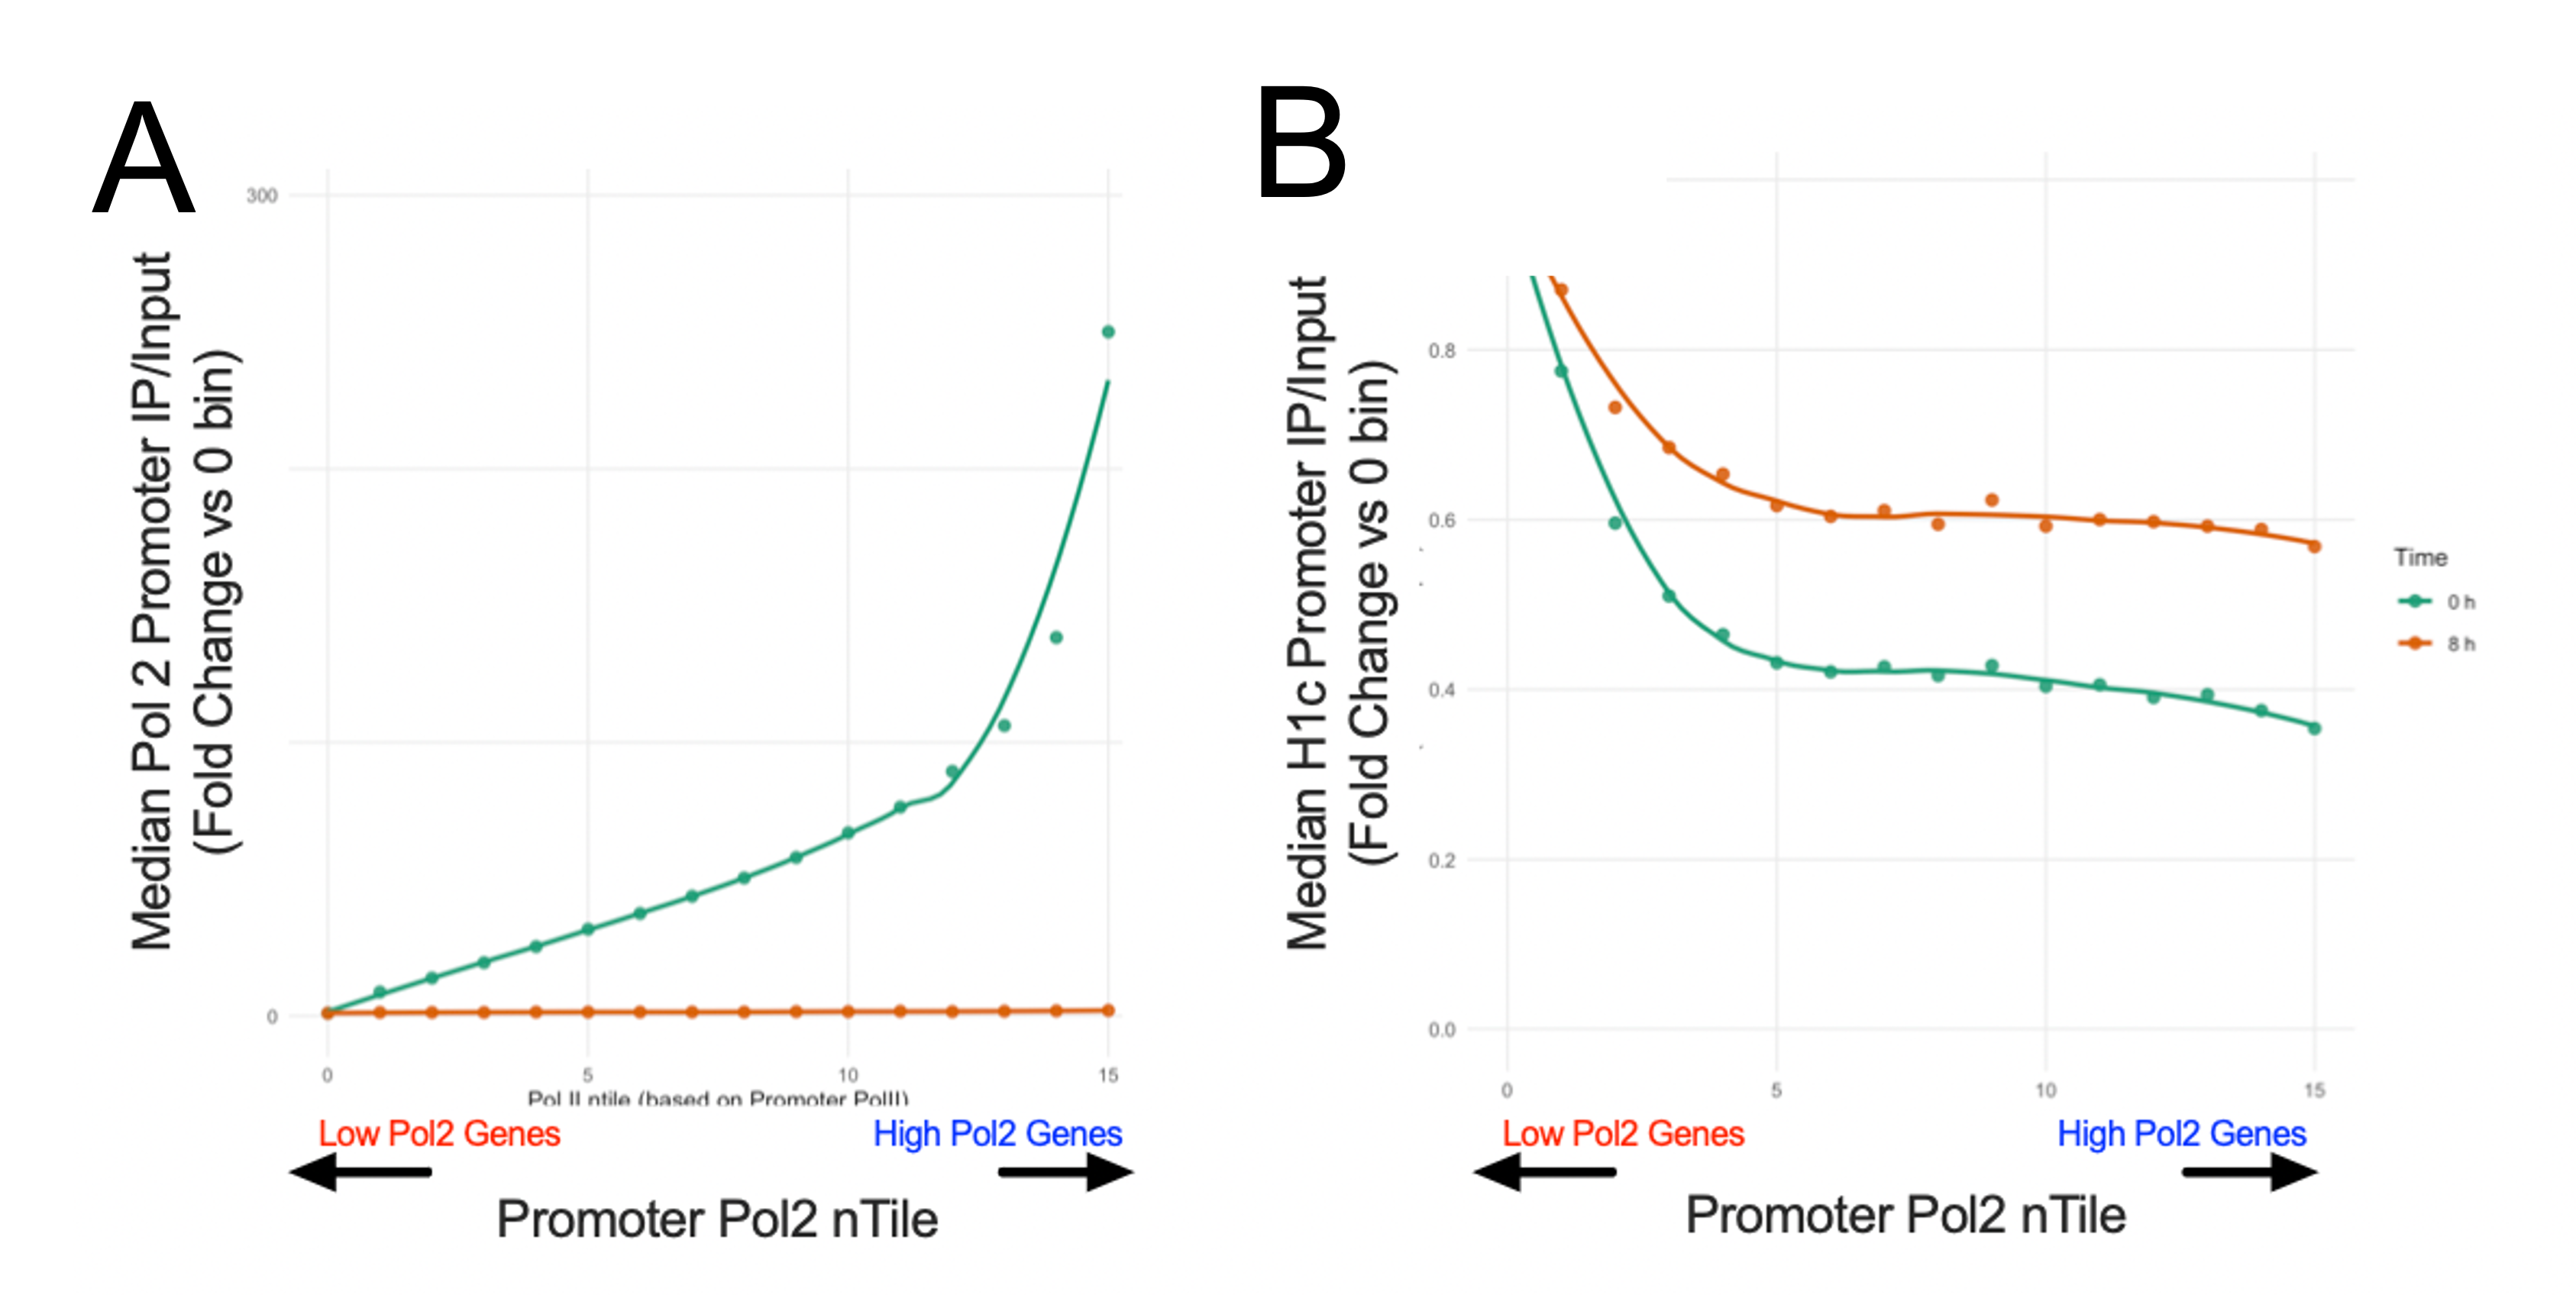 G1E-ER4 cells were untreated (0 h) or treated with triptolide (8 h). Promoters were ranked by baseline (0 h) promoter Pol II ChIP-seq signal and divided into 15 equal-sized n-tiles from low to high Pol II; each point is one n-tile, and the y-value is the median promoter signal for that n-tile (Pol II or H1c, as indicated), expressed as fold-change relative to the lowest-Pol-II n-tile at the same timepoint. (A) Pol II ChIP-seq: triptolide nearly abolishes promoter Pol II across all n-tiles (orange), whereas 0 h shows the expected monotonic increase with Pol II rank (green). (B) H1c ChIP-seq: triptolide raises promoter H1, with the largest increases in high-Pol-II n-tiles, indicating that transcription is required for promoter H1 depletion.