
Neonatal Pulmonology
Session: Neonatal Pulmonology - Clinical Science 6: PEEP and Non-Invasive Ventilation
 photo")
Jasmine Chapdelaine (she/her/hers)
Medical Student
McGill University Faculty of Medicine and Health Sciences
Montreal, Quebec, Canada
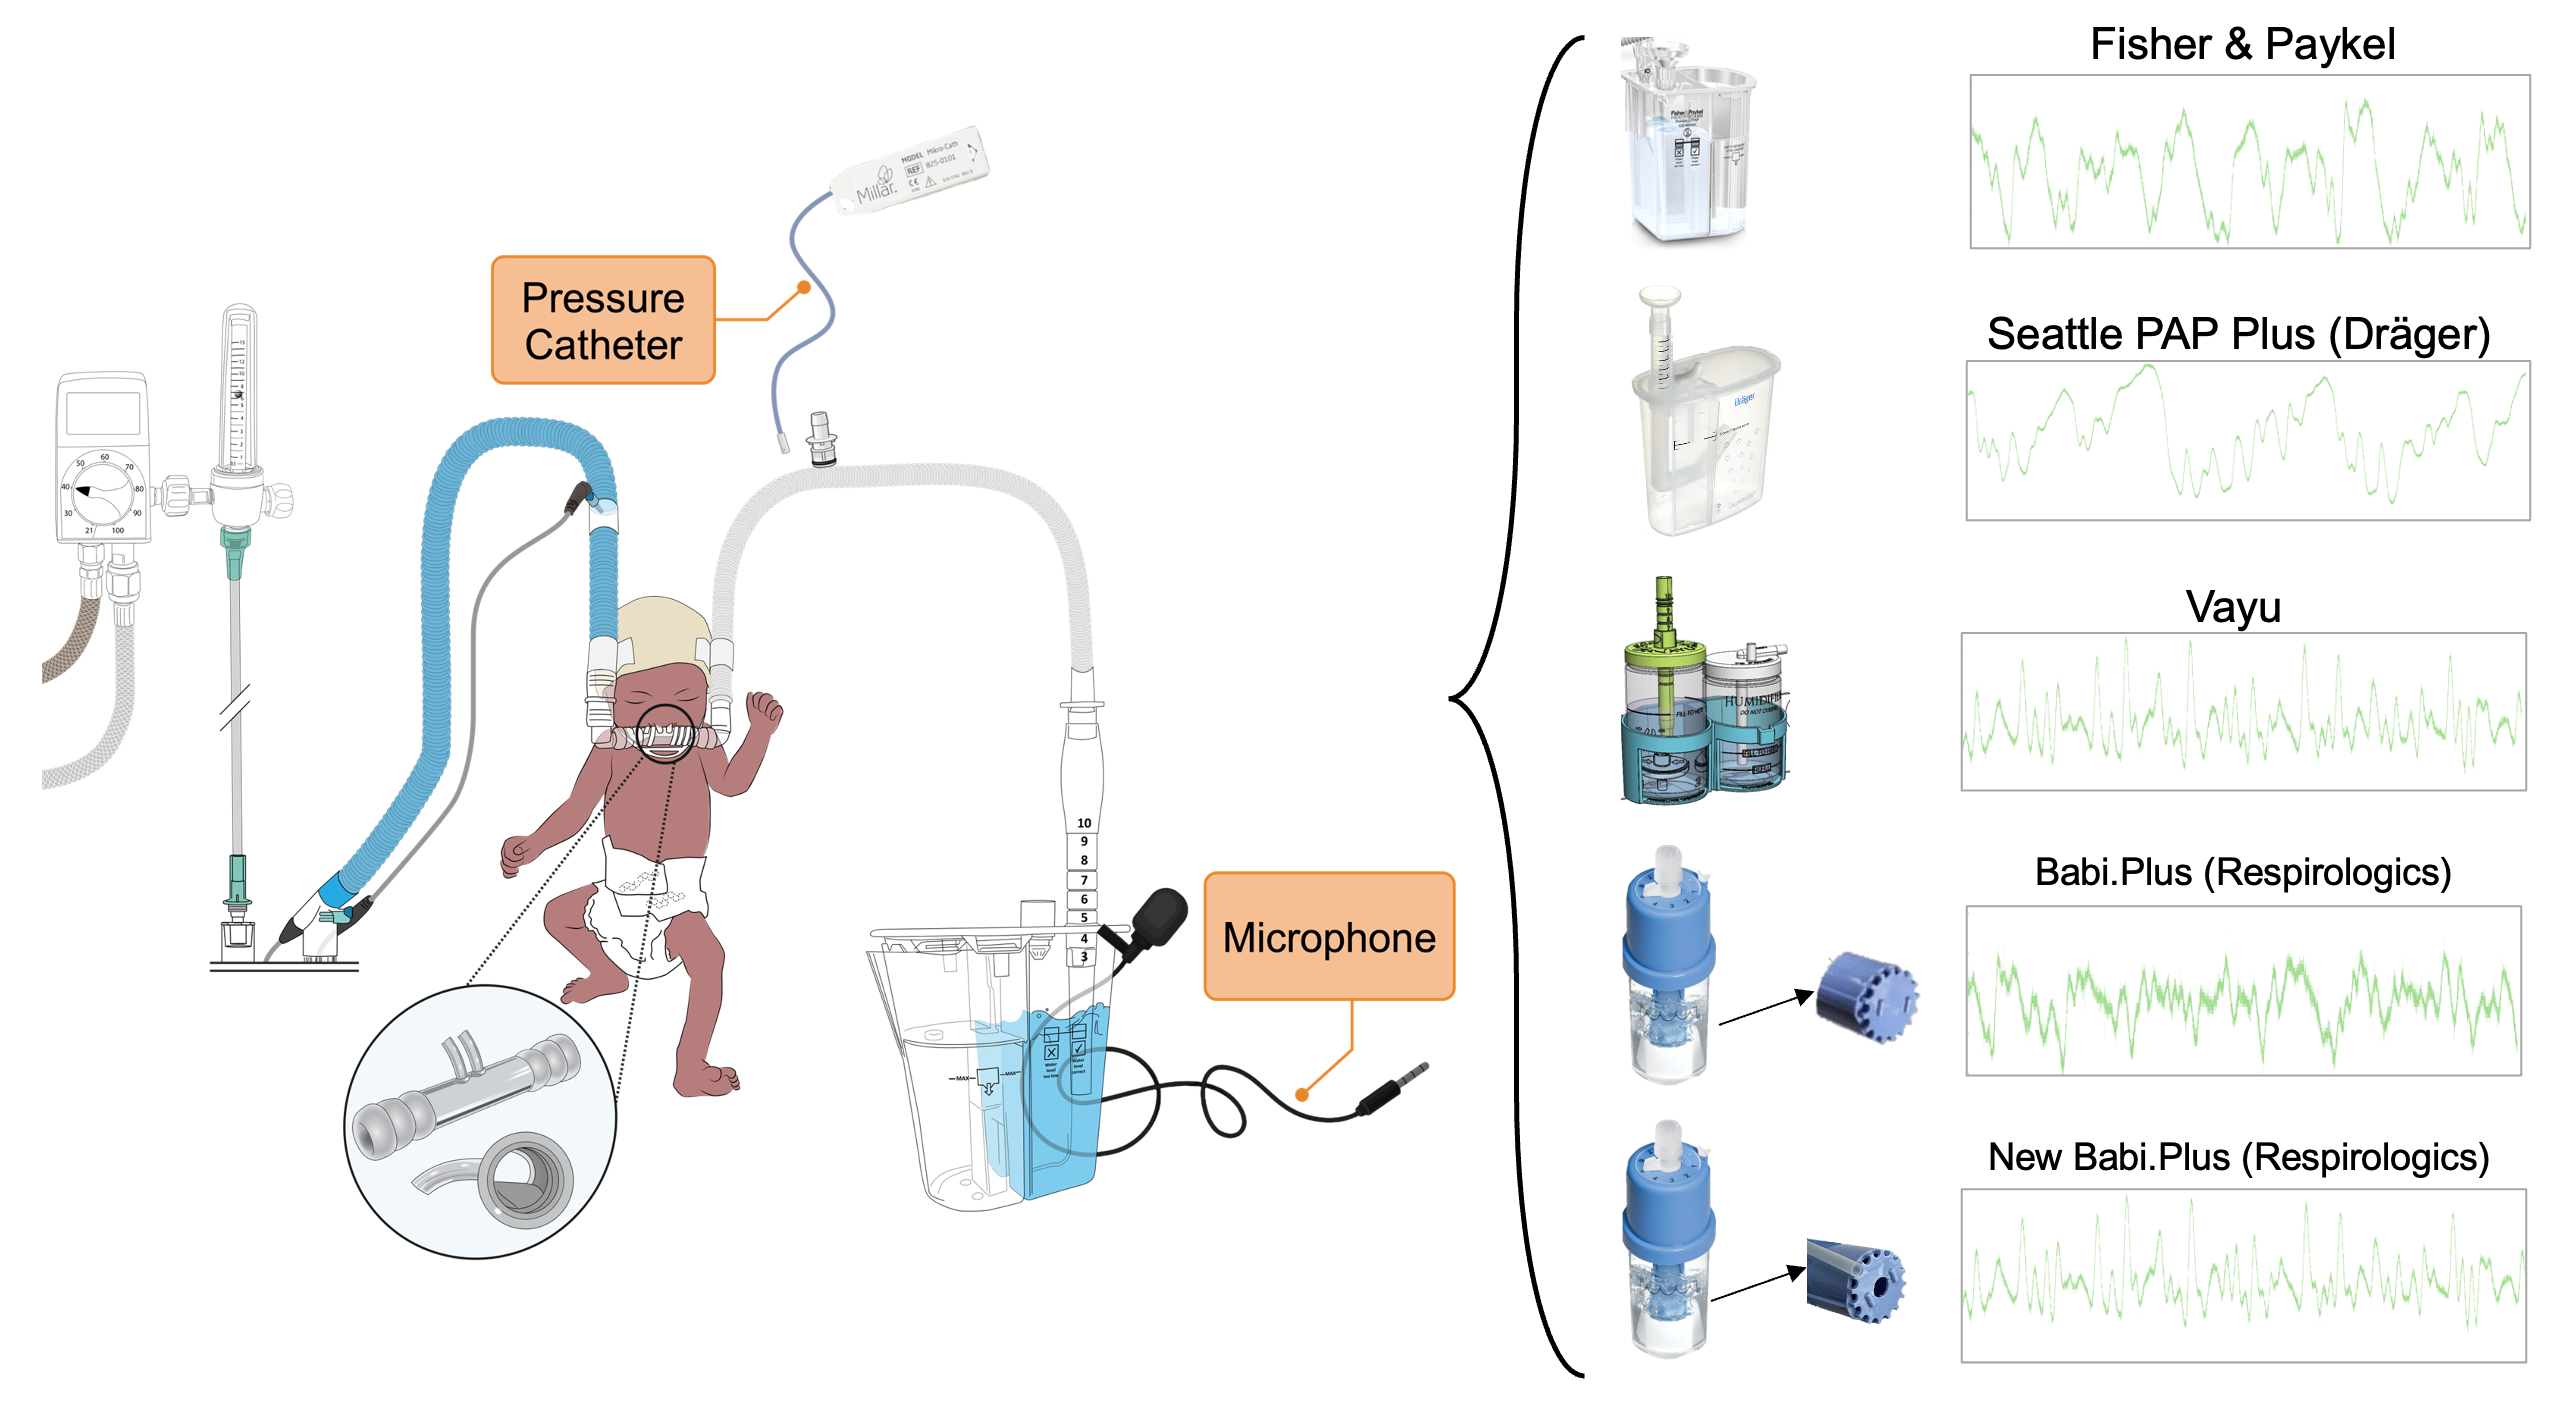 A 36-week neonatal manikin with anatomically correct upper airways was connected via a standardized prong interface (Babi.Plus nCPAP kit, size 2 prongs) to each of the 5 bCPAP devices: Fisher & Paykel Bubble CPAP, Seattle PAP Plus (Dräger), Vayu Bubble CPAP, the original Bubble Babi.Plus (Respirologics) and its new iteration with an additional 7.3 mm hole in the expiratory limb (New Babi.Plus). Bubbling sounds were recorded with a lavalier microphone at the level of the water canister. A Mikro-Tip (Millar) pressure catheter placed into the proximal expiratory tubing measured the pressure into the system, as depicted by the raw pressure signals for each device.
 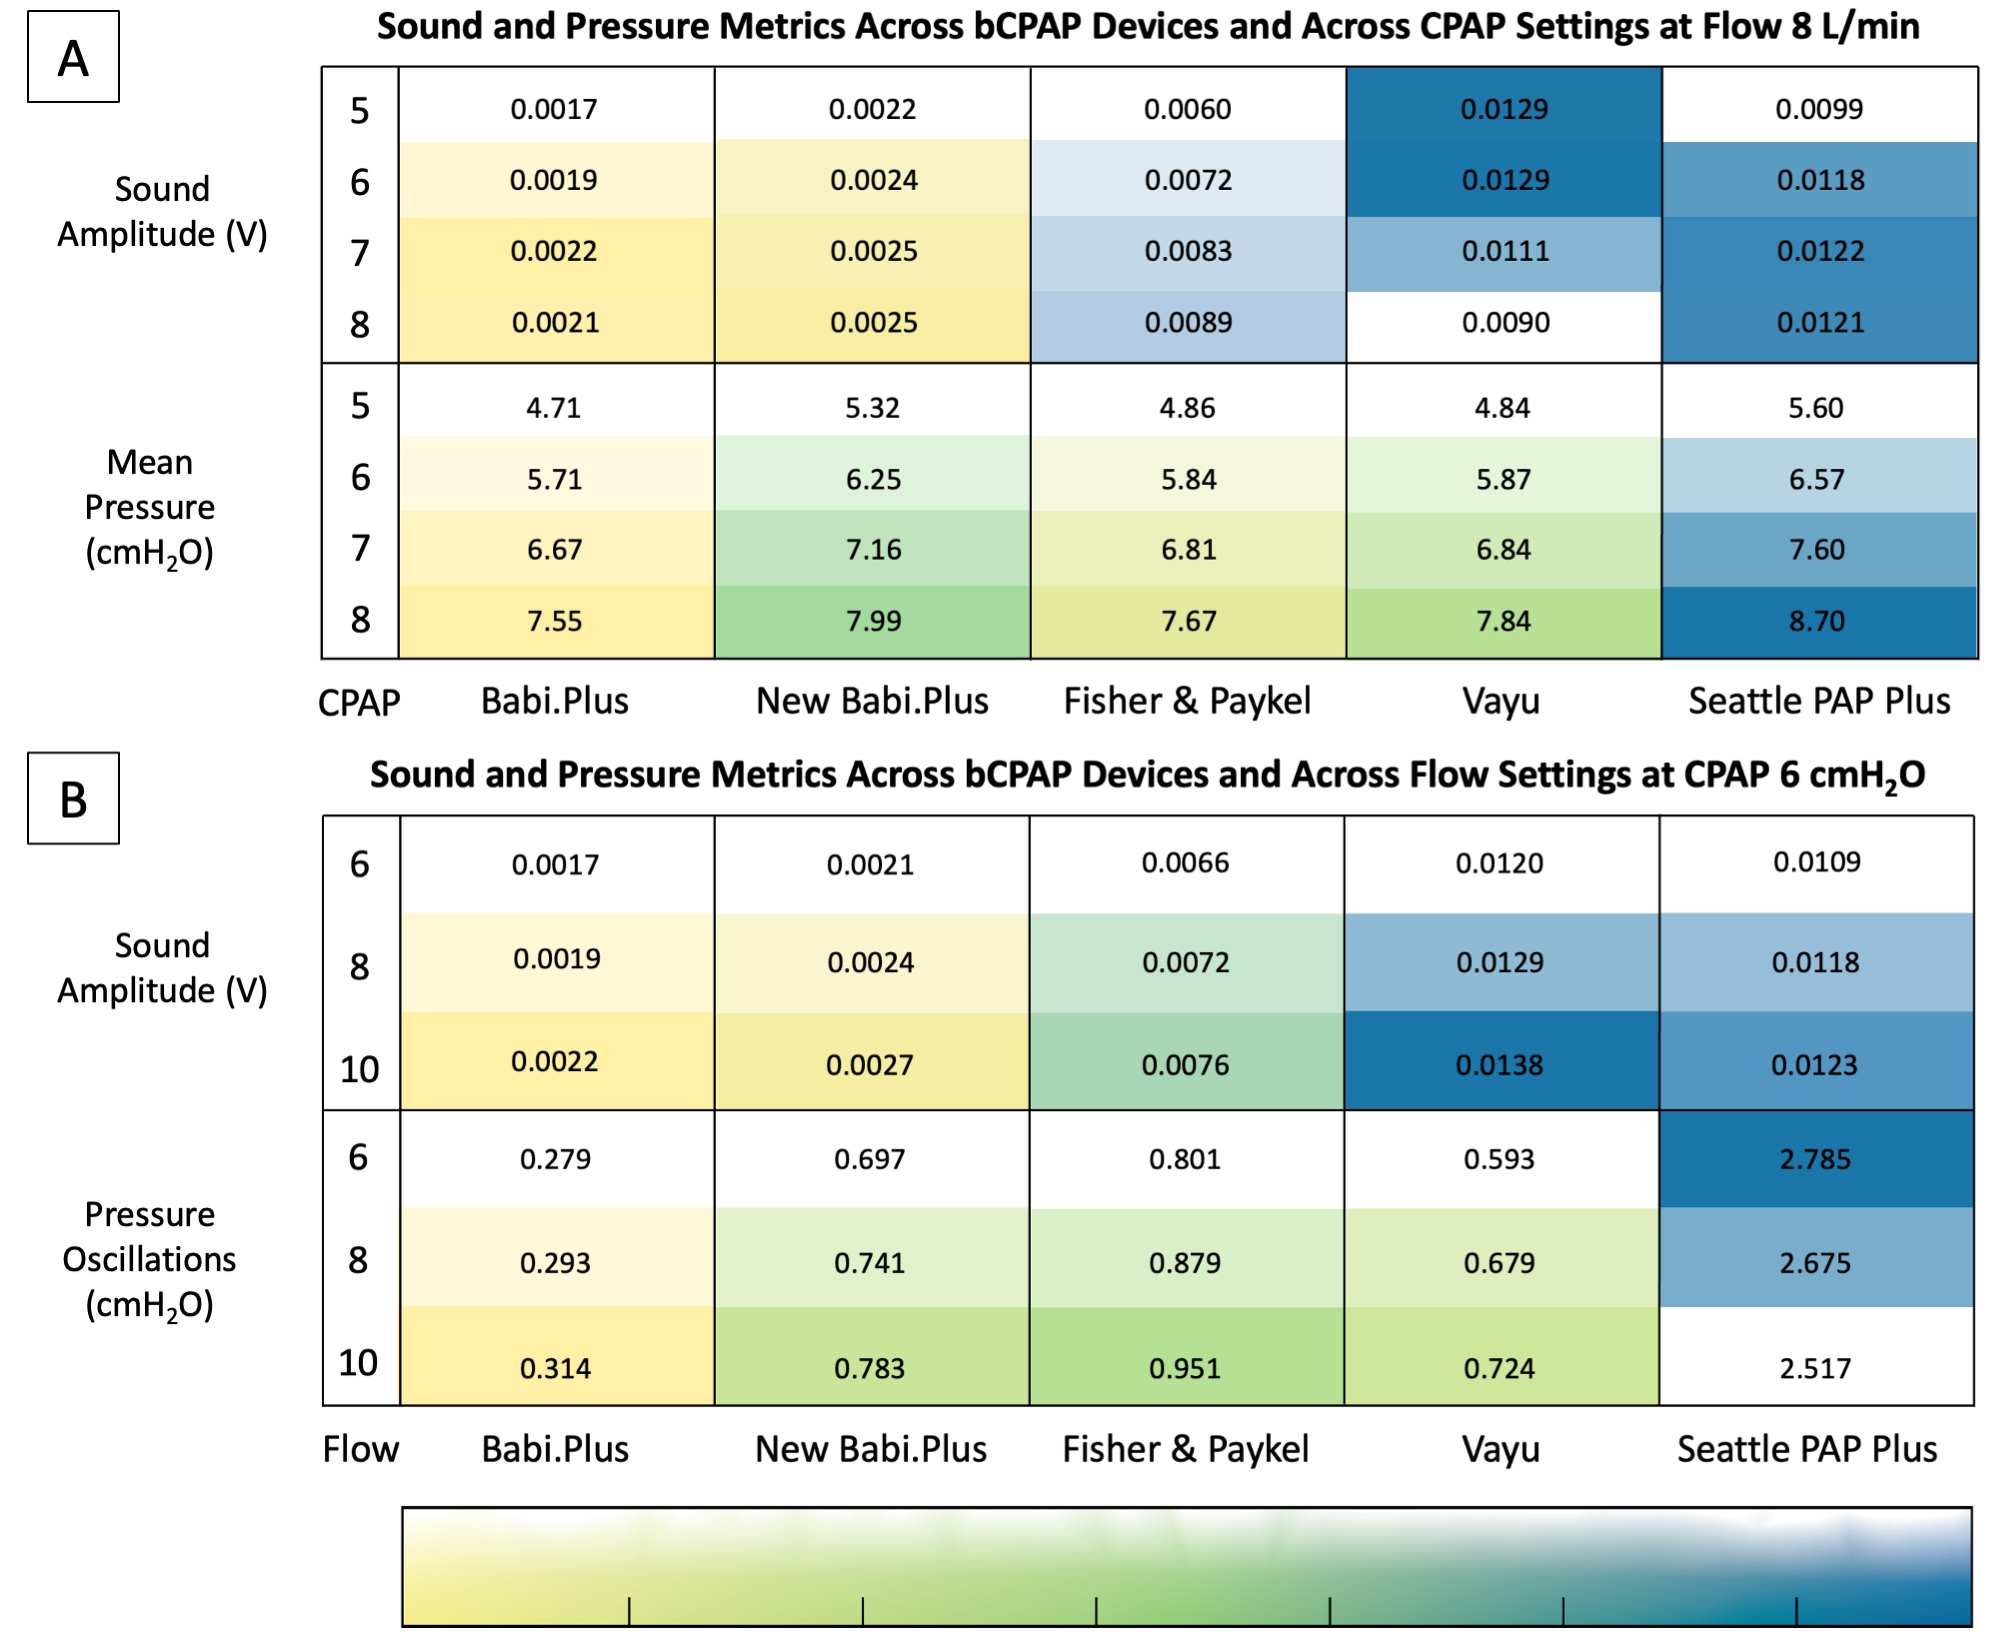 (A) For each CPAP setting at a set flow of 8 L/min, sound amplitude and mean pressure measured at the expiratory limb (y-axis) are compared across the five tested devices (x-axis). (B) For each flow setting at a set CPAP of 6 cmH2O, sound amplitude and pressure oscillations (y-axis) are presented across devices. The horizontal color gradient, with yellow representing lower values and dark blue representing higher values, allows for comparison across devices. The vertical gradient, from white to opaque, depicts the variable patterns across system settings.
 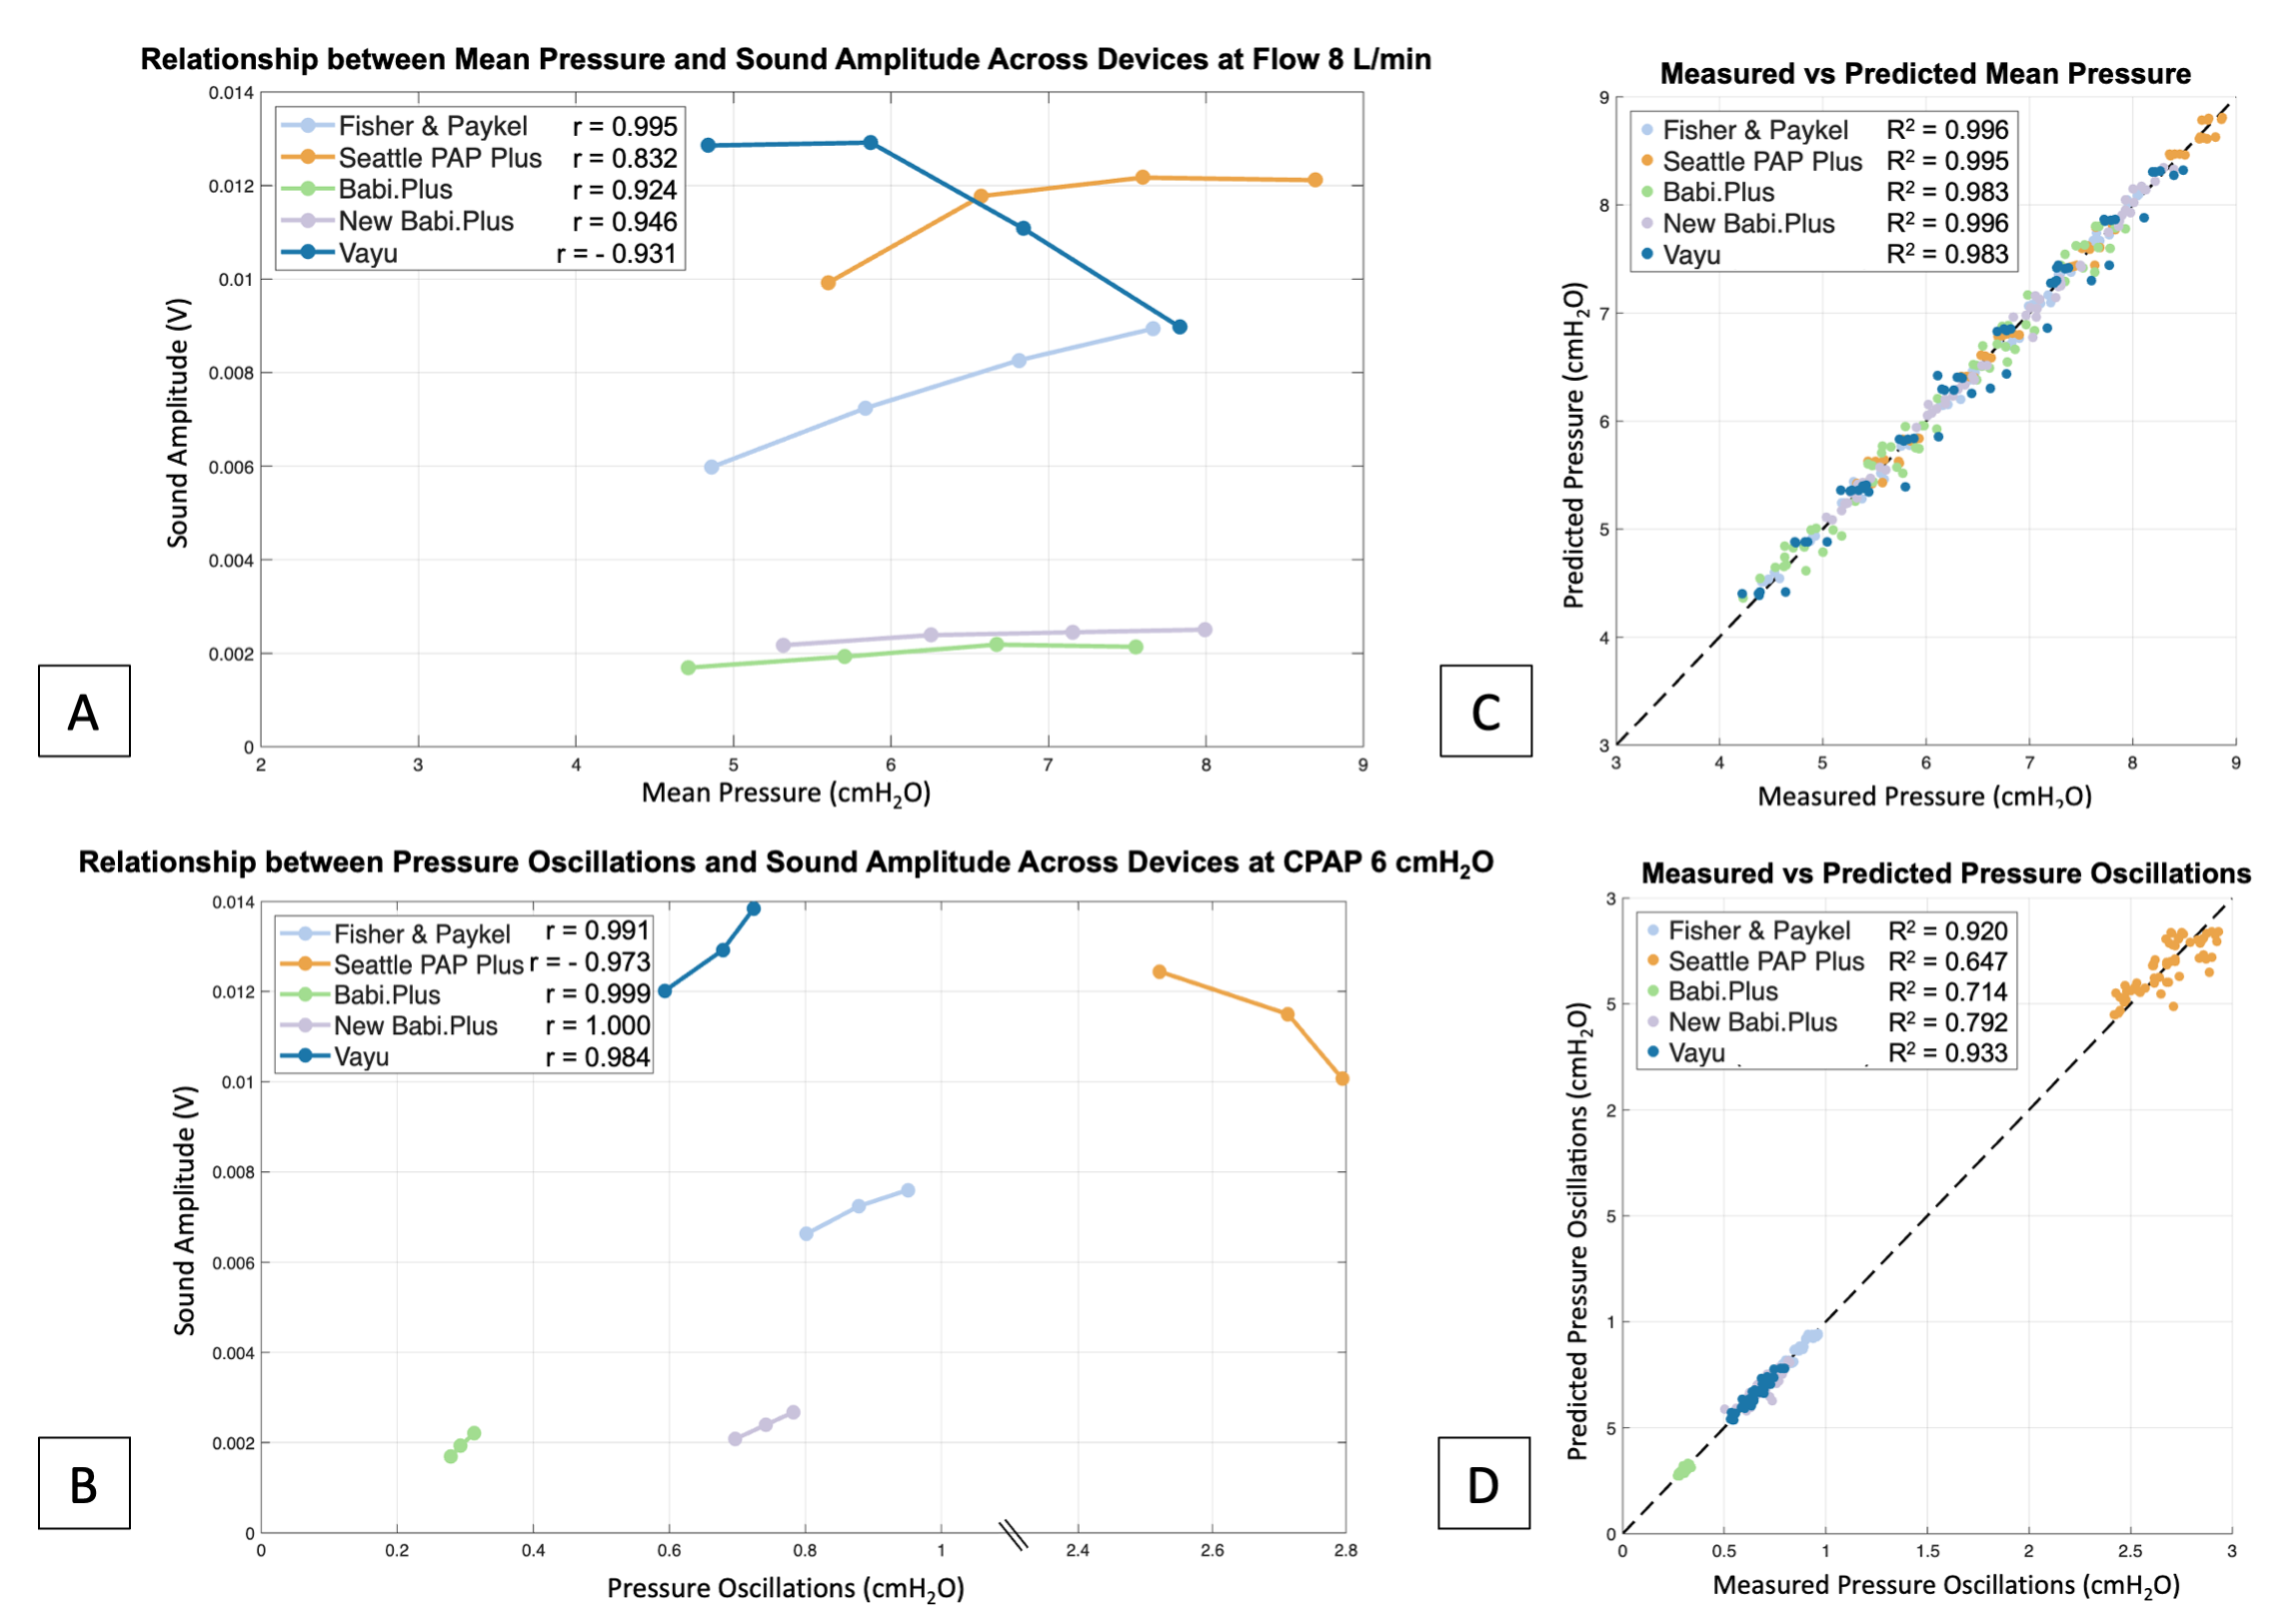 For the trials at a flow of 8 L/min, mean pressure measured at the expiratory limb and sound amplitude were plotted and exhibited strong correlations across all devices (r = 0.832-0.995). Most devices demonstrated positive correlations, whereby an increase in sound relates to greater pressure delivery, except for the negative correlation of the Vayu. Similarly, Figure 3B illustrates the strong correlations (r = 0.973-1.000) between pressure oscillations and sound amplitude, for the trials at a pressure of 6 cmH2O. All devices displayed positive correlations, with the exception of Seattle PAP Plus, suggesting that greater bubbling sounds relate to less oscillations. Individual linear regression models were created for each device to predict both mean pressure (C) and pressure oscillations (D) from set CPAP level, set flow level, and bubbling sound amplitude. These metrics were accurately estimated (R2 = 0.647-0.996) across devices.