
Genomics/Epigenomics
Session: Genomics/Epigenomics 2
 photo")
Qifei Li, PhD (he/him/his)
Assistant Professor
University of Miami Miller School of Medicine and Holtz Children's Hospital
Miami, Florida, United States
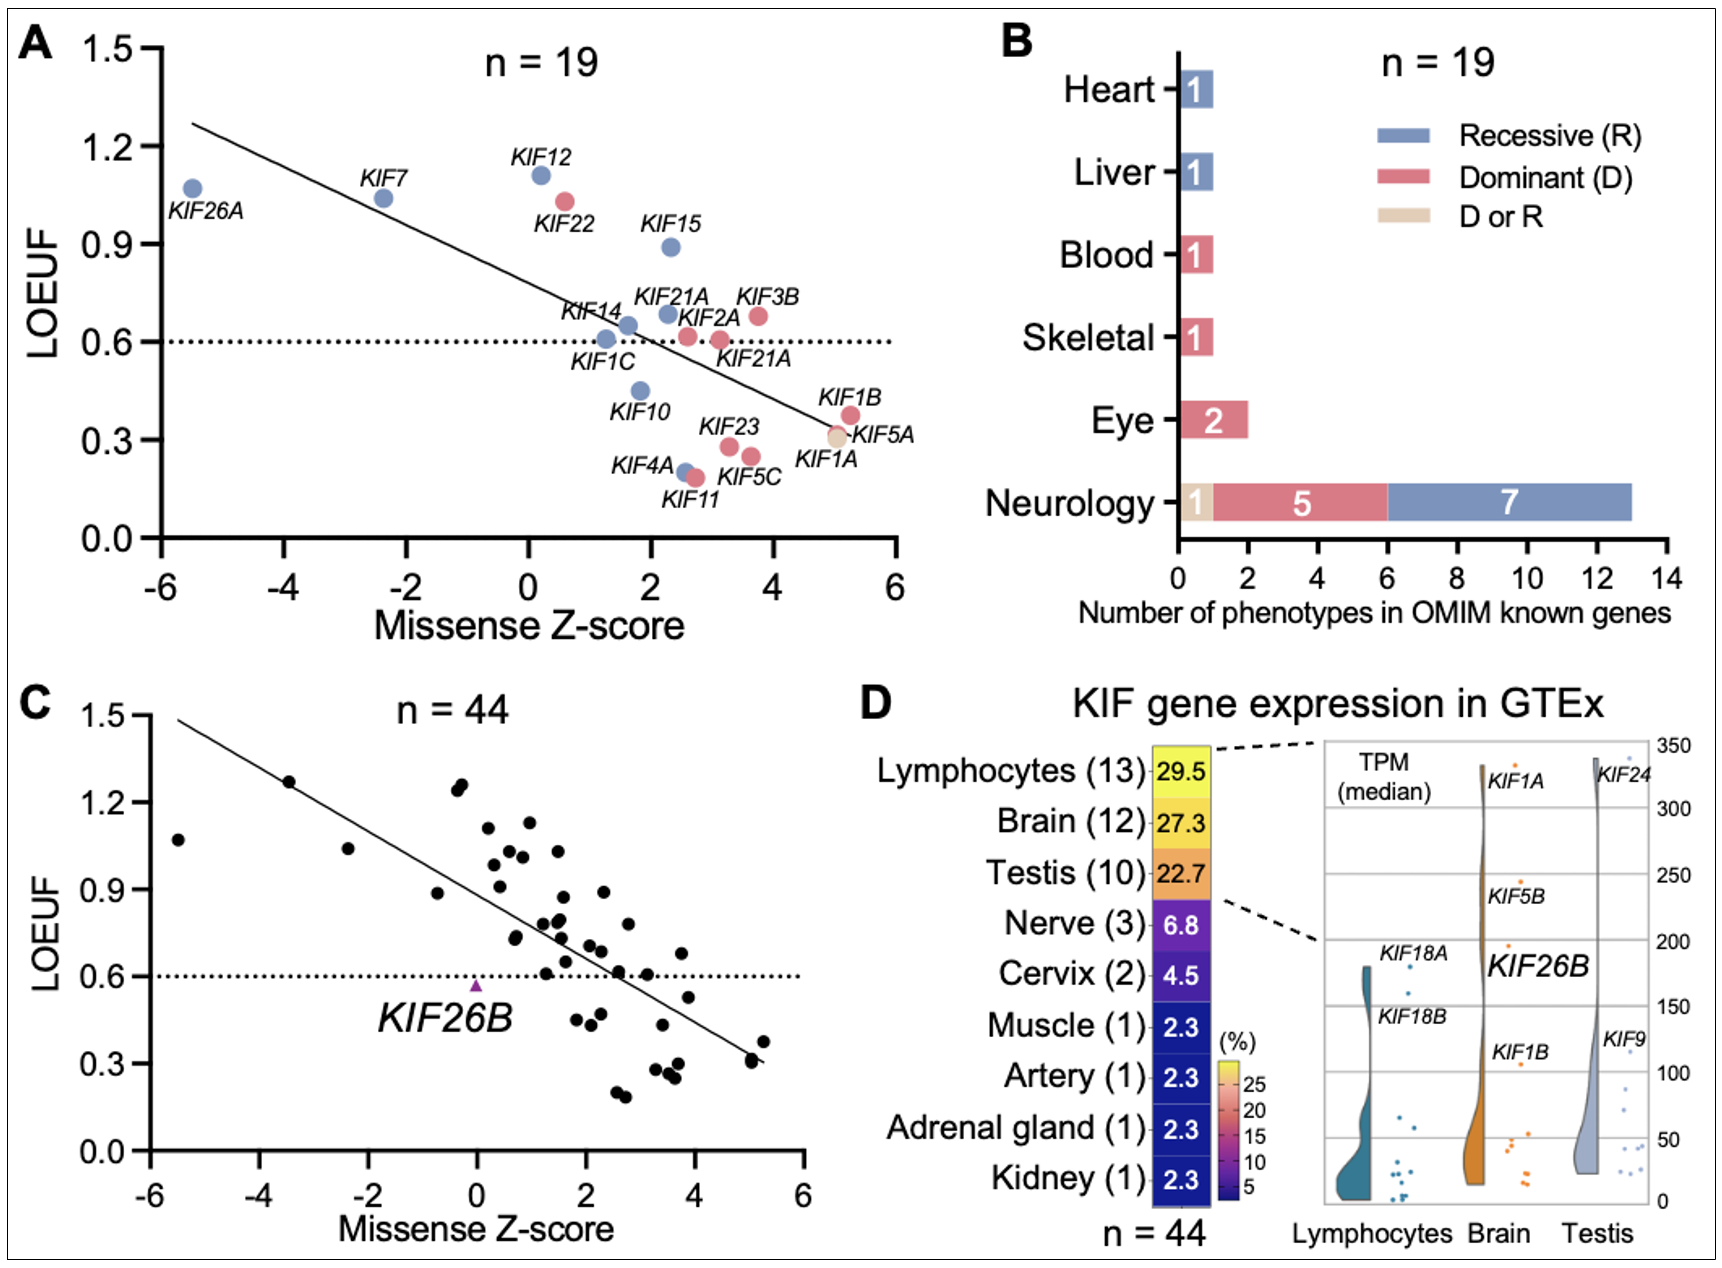 Fig. 1. Loss-of-function and missense tolerance in the KIF superfamily. (A) Relationship between the missense and LOEUF scores. Genes linked to dominant diseases are shown in red, those linked to recessive are shown in blue, and those linked to mixed dominant and recessive are shown in orange. (B) Disease and inheritance distribution of 19 Known KIF genes cataloged in OMIM. (C) Relationship between the missense and LOEUF constraints among all 44 KIF genes. KIF26B is indicated by a purple triangle. (D) Heatmap of the transcription levels of all 44 KIF genes in various tissues.
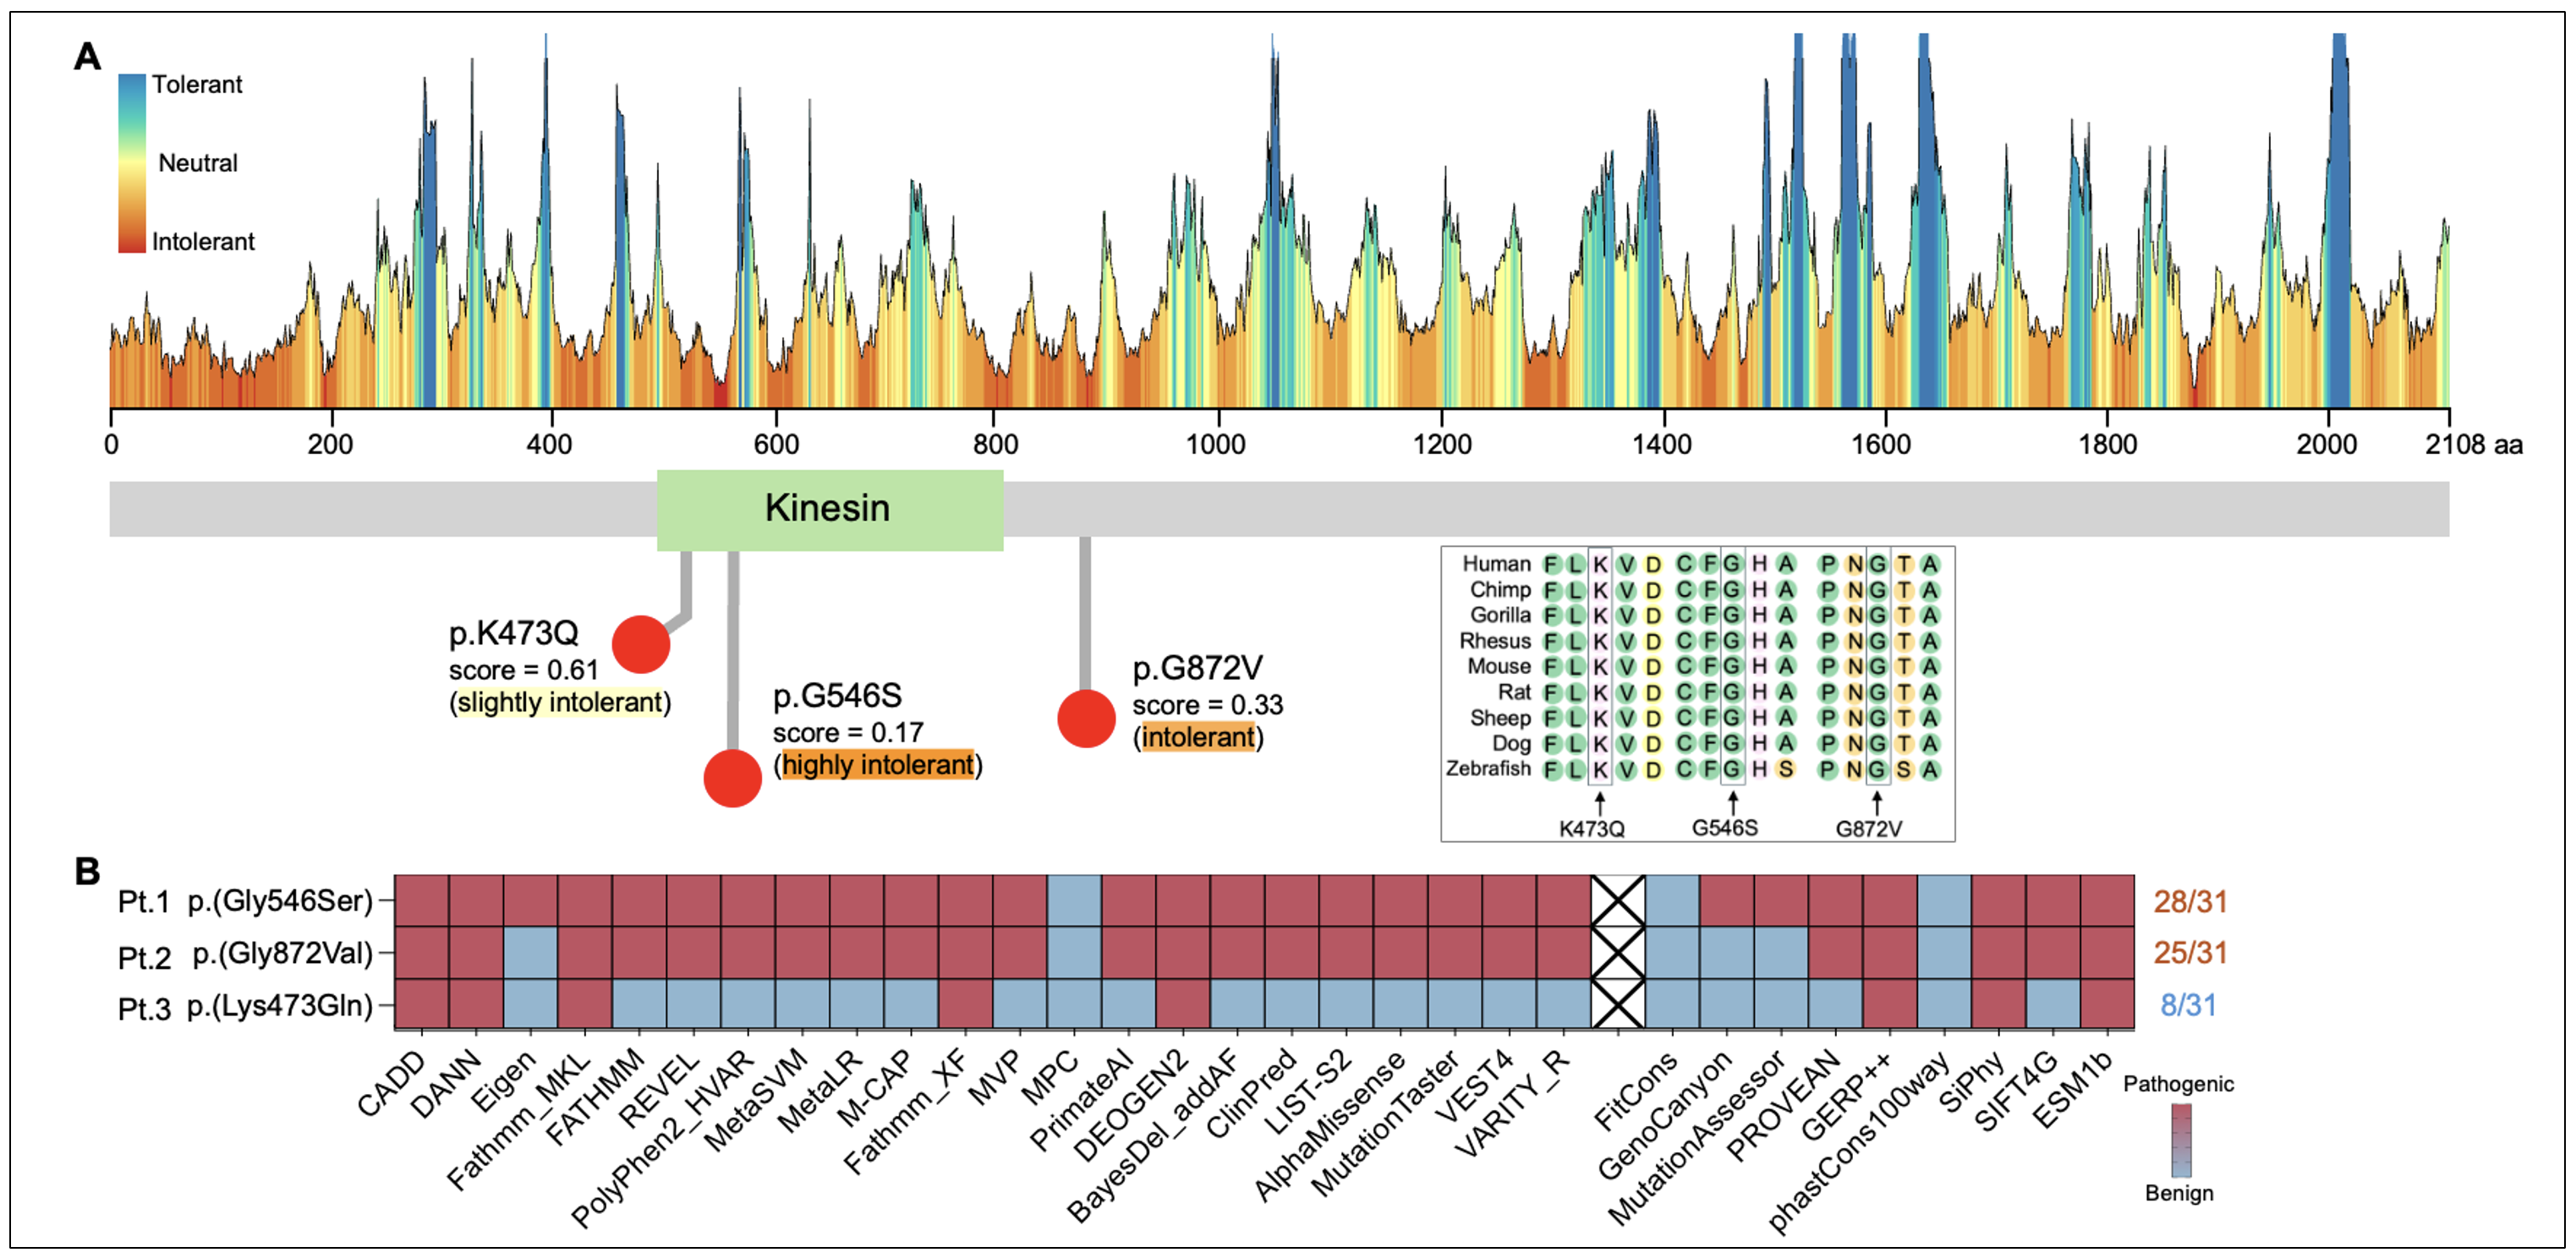 Fig. 2. Three de novo KIF26B variants. (A) KIF26B variant tolerance analysis with MetaDome.2 The corresponding amino acids of KIF26B variants (arrows) are evolutionally conserved in orthologous species. Green: non-polar amino acids; Orange: polar amino acids; Pink: positive charge; Yellow: negative charge. (B) Variants are evaluated using in silico prediction tools. Red colors indicate pathogenic effects and blue colors for benign.
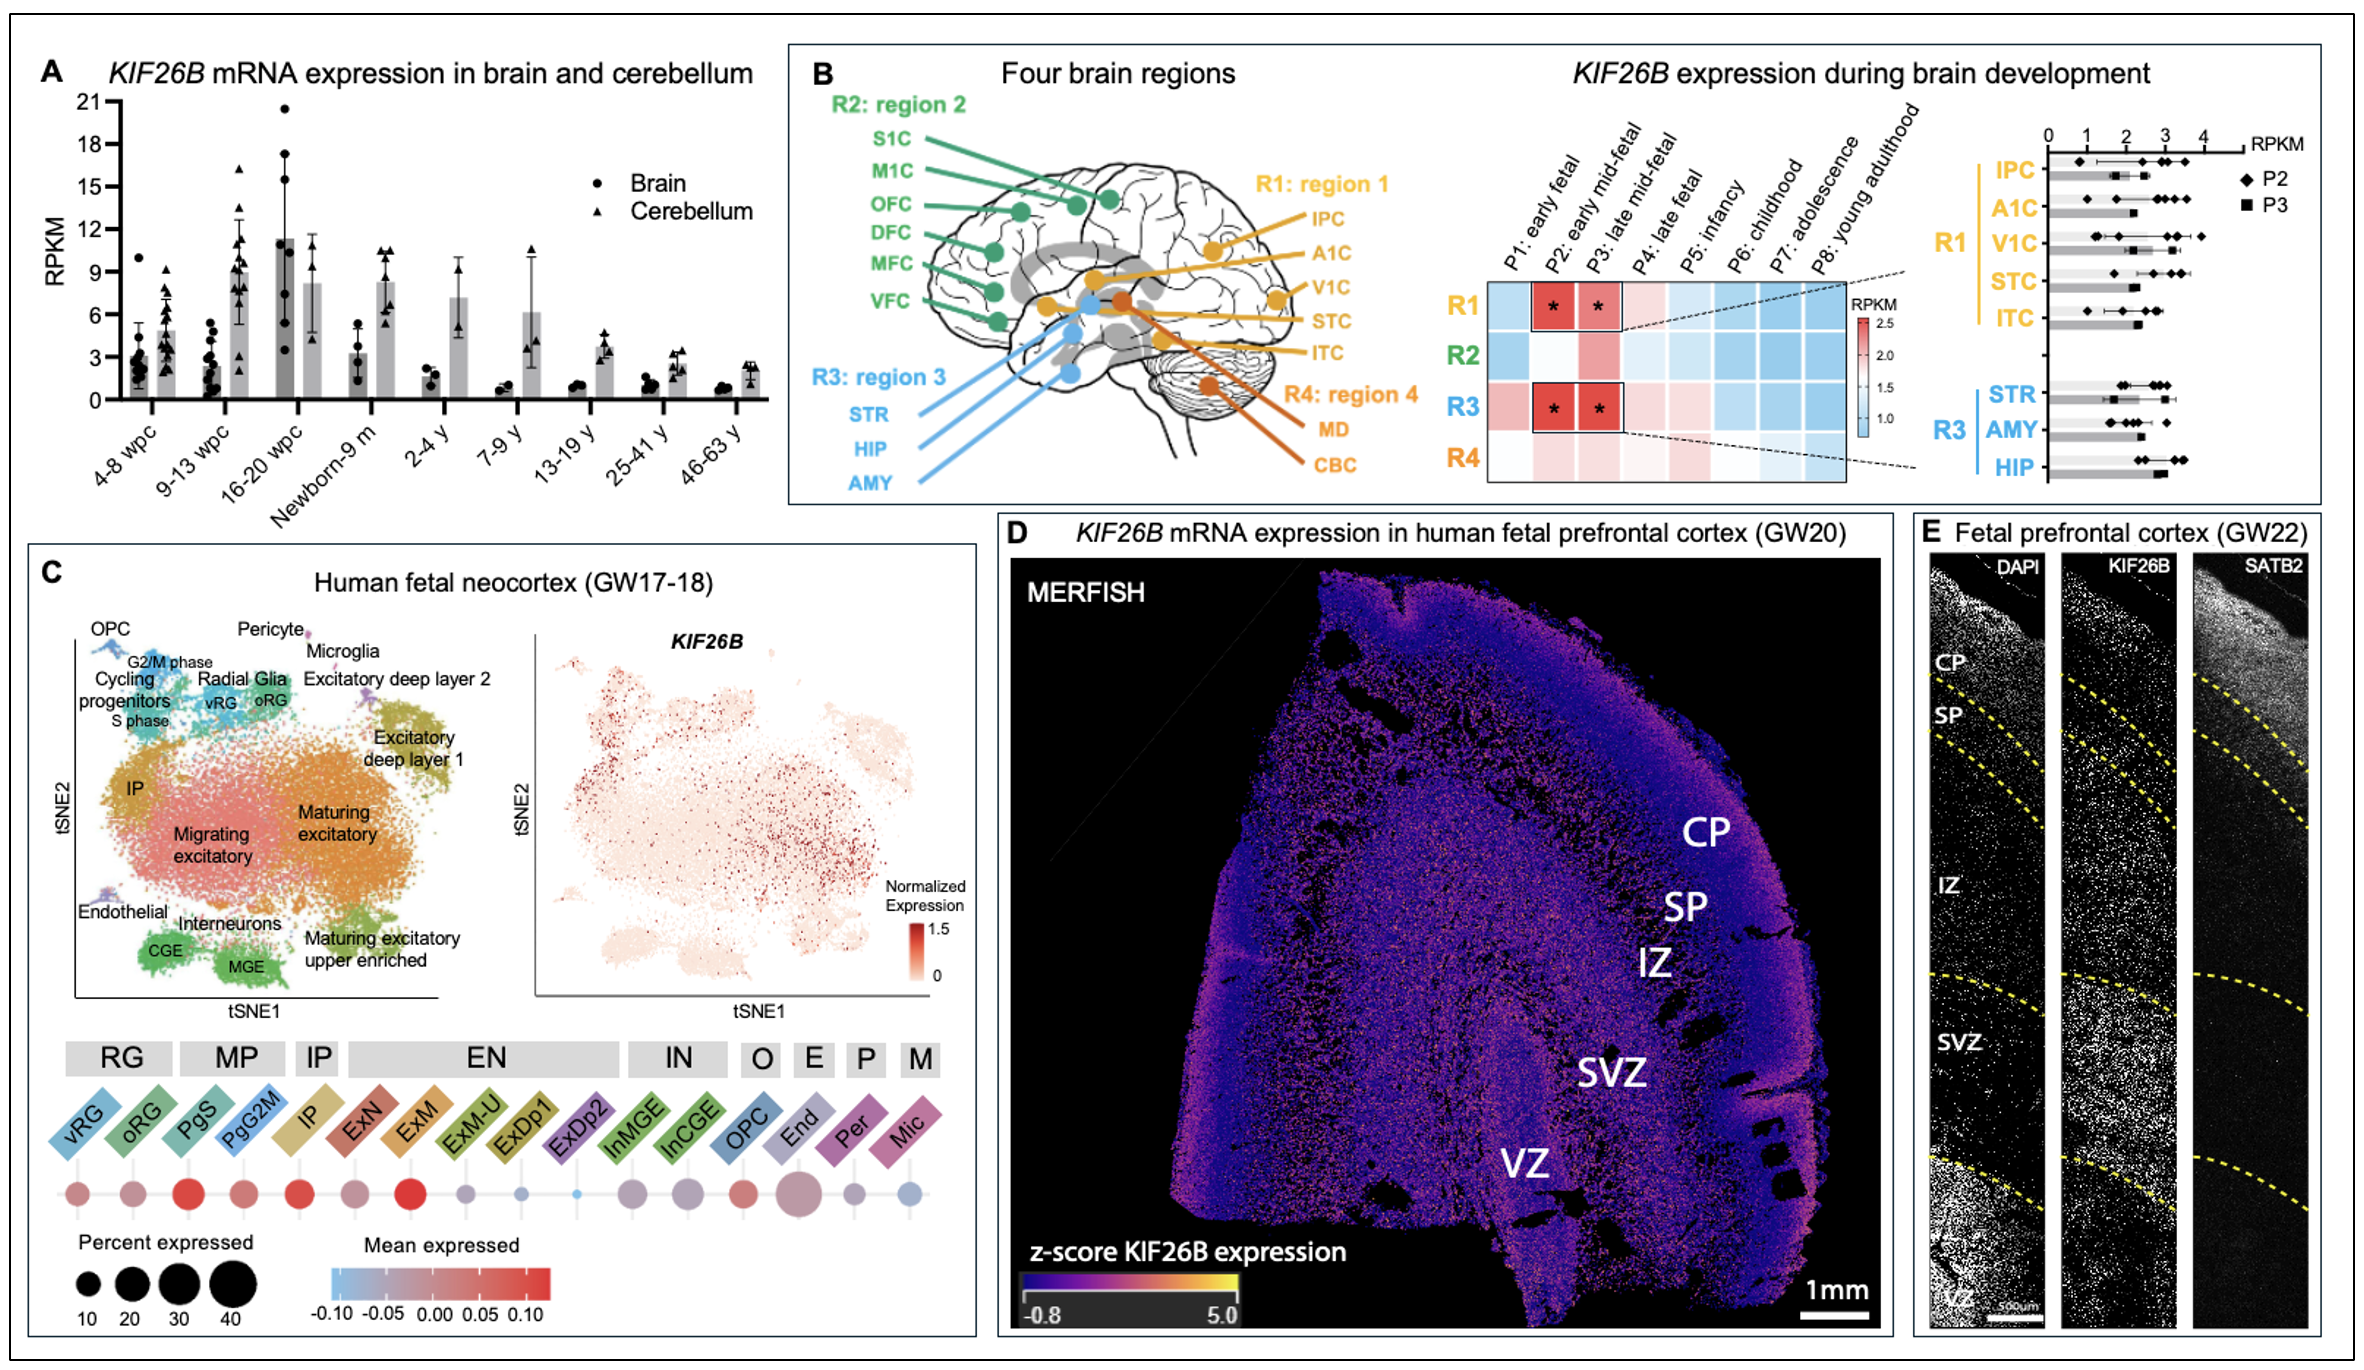 Fig. 3. Human KIF26B mRNA expression in brain. (A) KIF26B mRNA expression during brain development.3 (B) KIF26B mRNA throughout human embryonic and postnatal brain development adapted from Lin et al.'s study.4 (C) Cell-type clusters (left) and feature plot showing KIF26B mRNA expression (right) in GW17-18 fetal cortex. The dataset were obtained from Polioudakis et al.5 (D) Spatial z-score plot for KIF26B expression in the prefrontal cortex (PFC) at GW20 analyzed by MERFISH. M(E) Immunostaining image showing KIF26B expression in fetal PFC at GW 22. KIF26B expression is enriched in the SVZ and upper layer of the CP. Scale bar, 500µm.