
Neonatal Hemodynamics and Cardiovascular Medicine
Session: Neonatal Hemodynamics and Cardiovascular Medicine 4
 photo")
Sara Manetta, MD (she/her/hers)
Neonatology Fellow
University of Virginia School of Medicine
Charlottesville, Virginia, United States
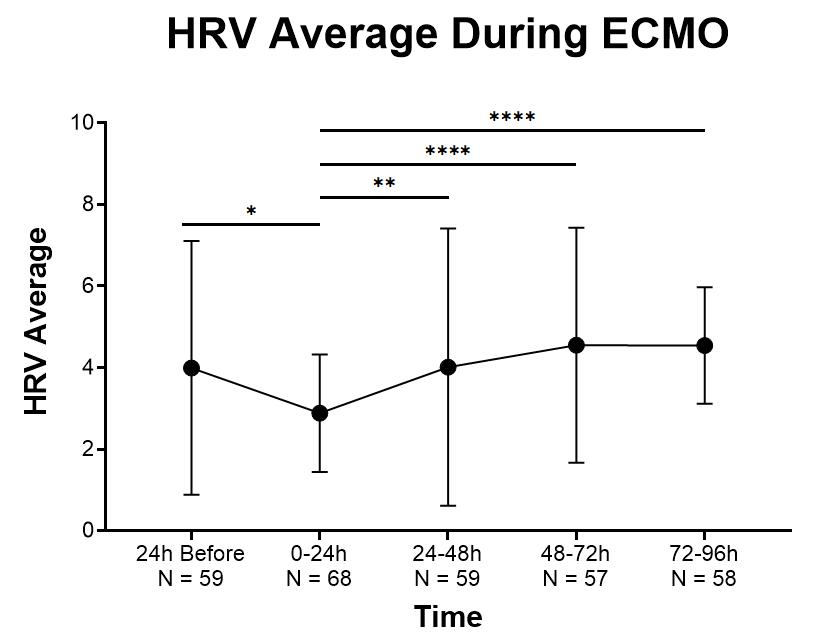 Average HRV over 24-hour periods before ECMO and 0-24, 24-48, 48-72, and 72-96 hours during ECMO. Dots represent a 24-hour average of HR standard deviation. Bracketed lines show the standard deviation of the average value. Mixed effect modeling random intercept model, to estimate the significance of changes over time. * p-value <0.05, ** p-value <0.01, and **** p-value <0.0001.
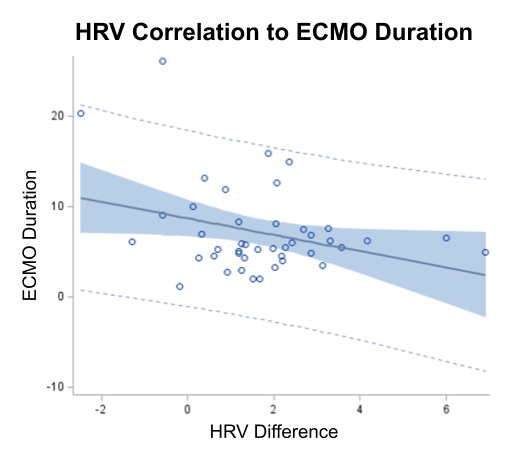 Correlation between average HRV difference from 0-24 hour period to 72-96 hour period and ECMO duration. HRV was measured by HR standard deviation. Dark blue line indicates the fit line, light blue shadow shows the 95% confidence limits, and light blue dotted line indicates 95% prediction limits.