
Neonatal Neurology
Session: Neonatal Neurology 9: Pre-Clinical 1
Eesha Natarajan, MD (she/her/hers)
Pediatric Critical Care Medicine Fellow
University of California San Francisco
San Francisco, California, United States
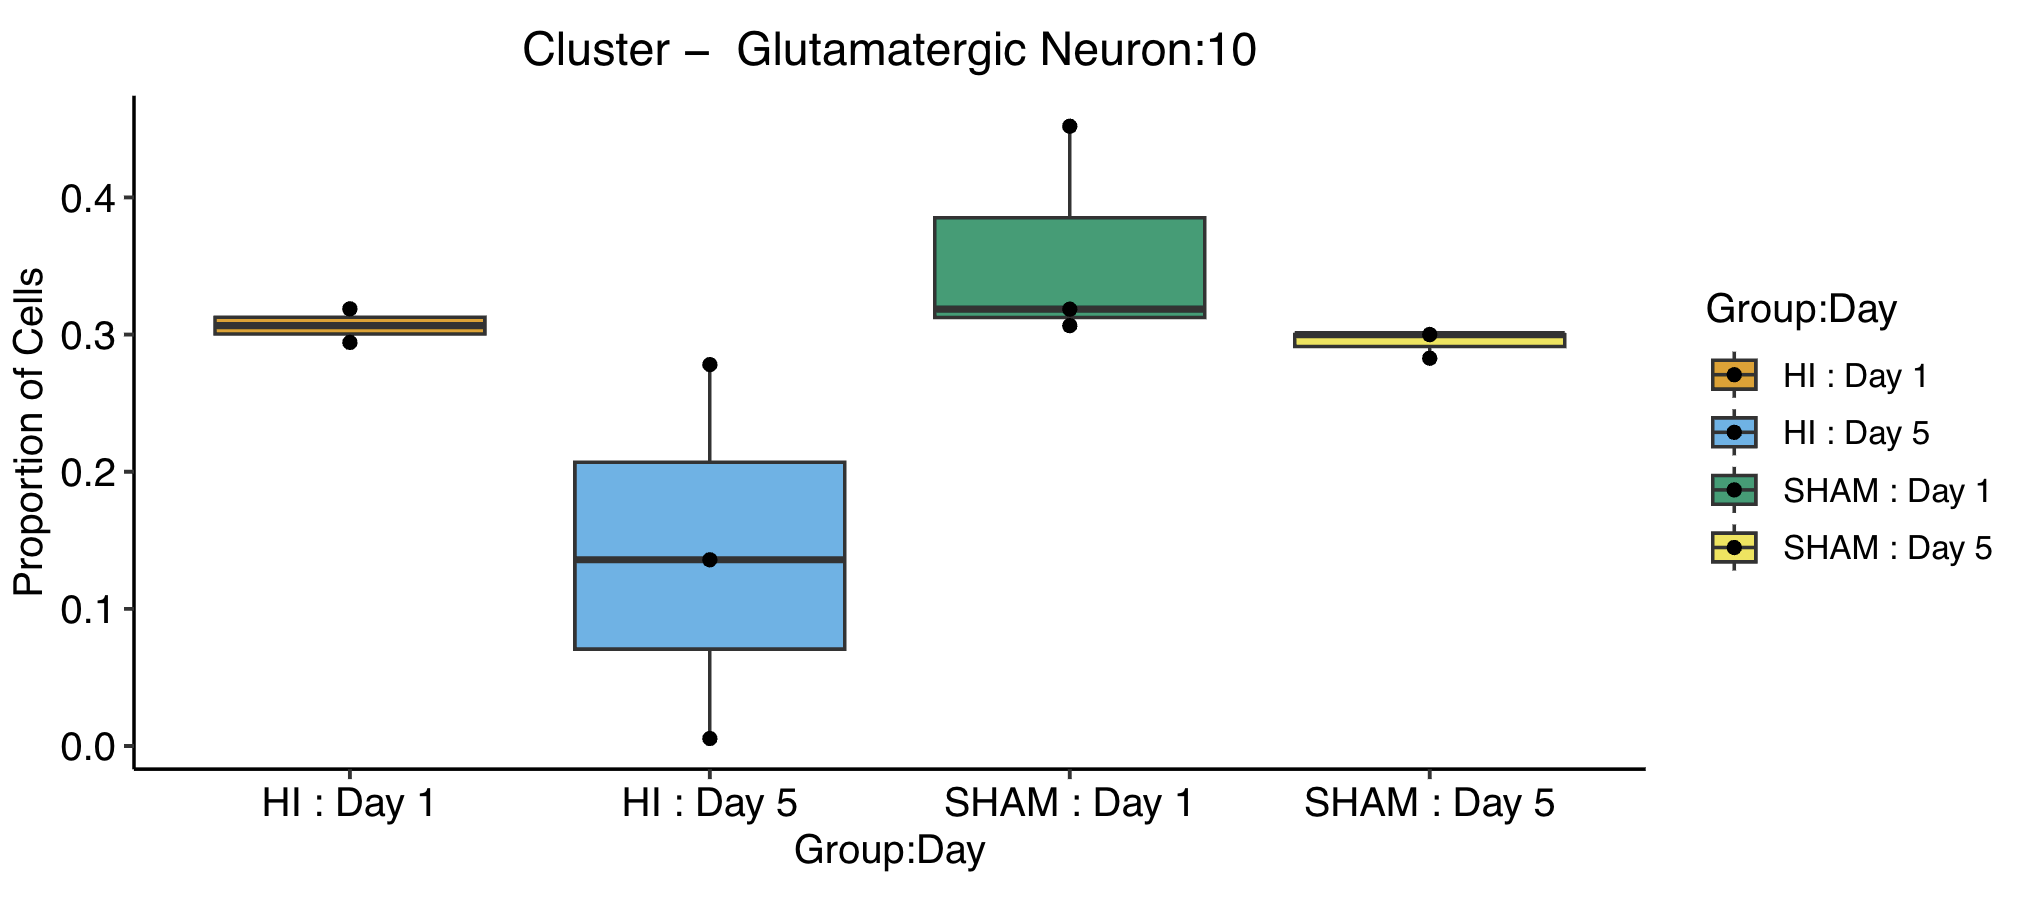 Box-and-whisker plots show the proportion of cells assigned to Cluster 10 on D1 vs D5 in HI animals vs sham controls. These glutamatergic neurons declined in abundance by D5 following HI, when compared with both HI D1 (p=7.46E-04) and sham D5 (p=5.5E-06), indicating a selective loss of neurons in response to HI.
 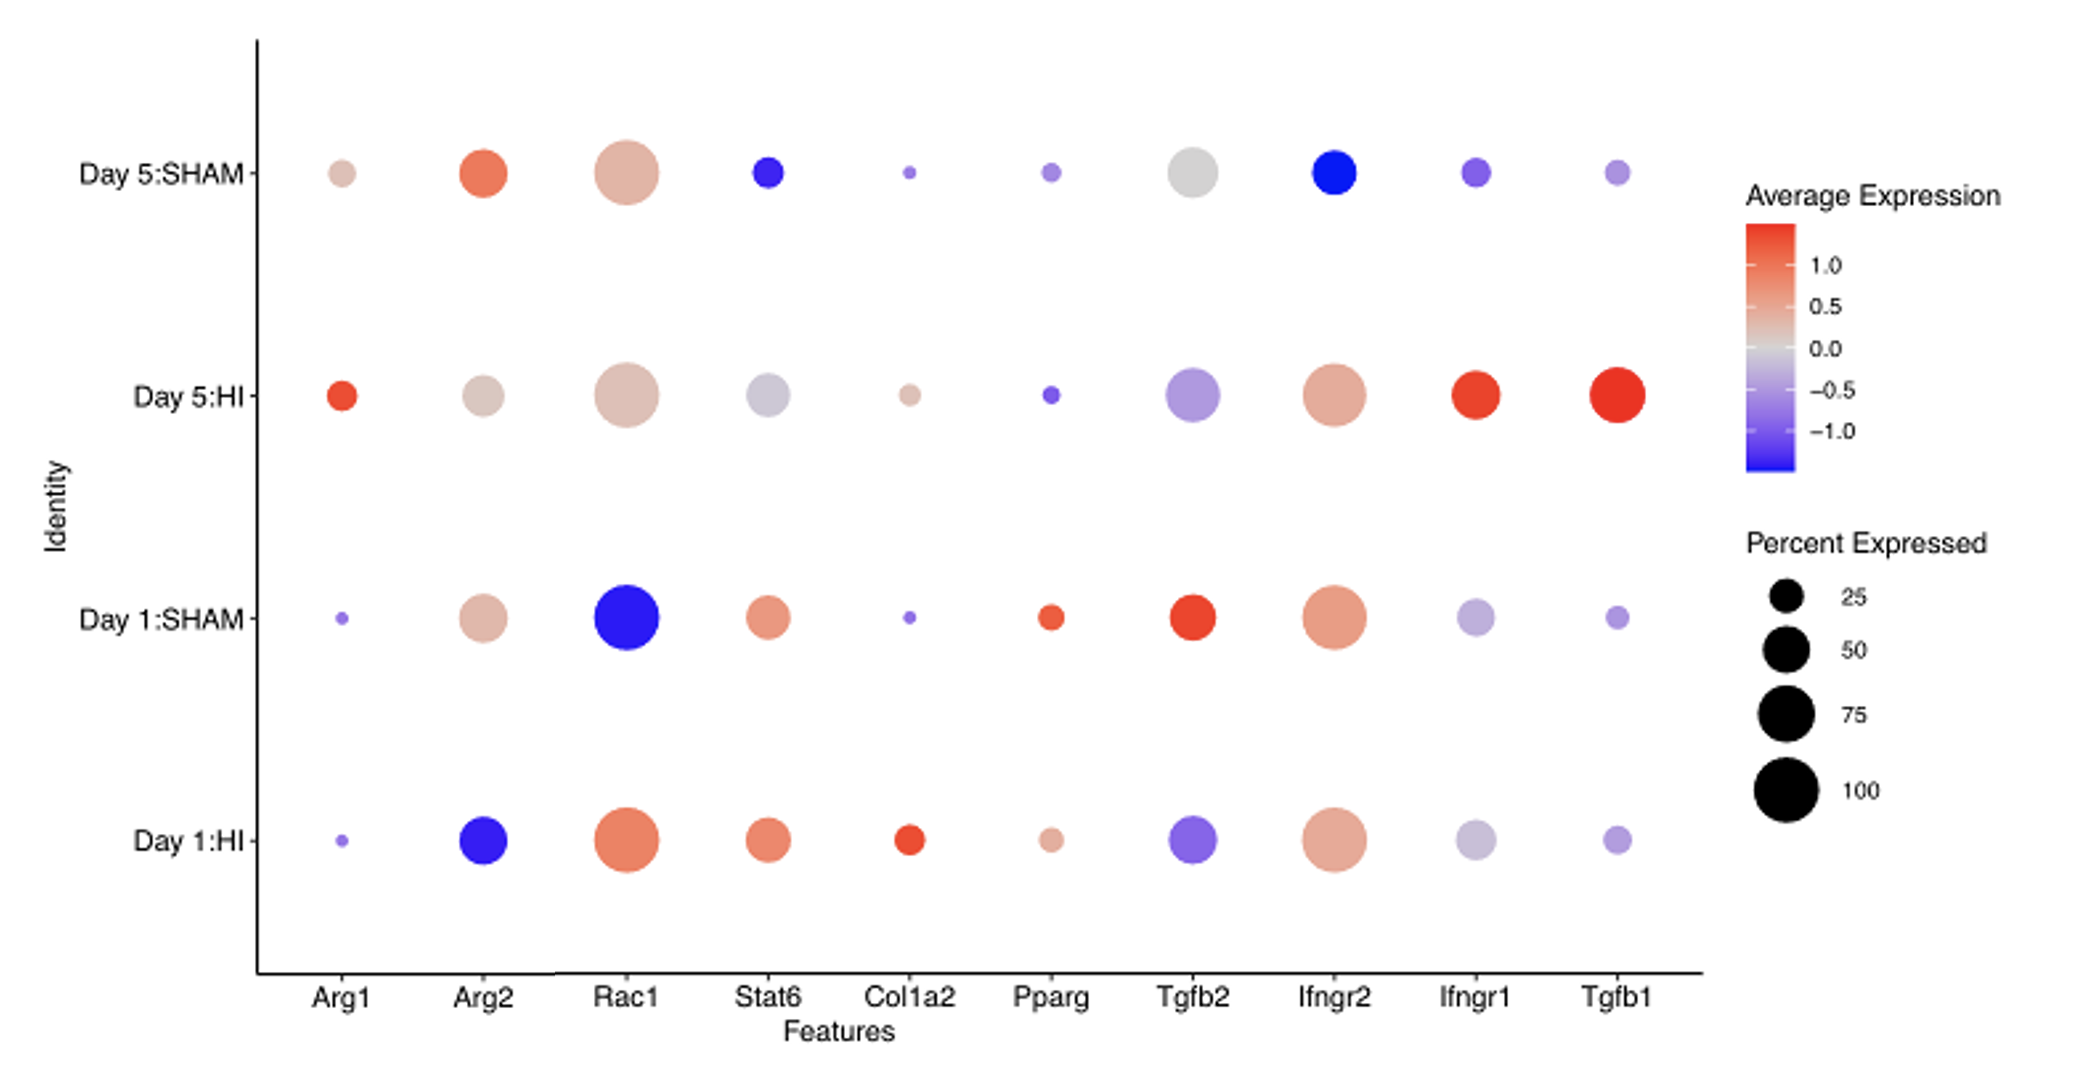 Dot plot shows average expression (color; red = higher, blue = lower) and percent of cells expressing each gene (dot size) across Day 1 and Day 5 HI versus time-matched shams. At Day 1 HI, these neurons display prominent Rac1 induction as well as increased COL1A2 expression compared to sham mice. By Day 5 HI, a broader remodeling/repair pathway emerged with increased ARG1, COL1A2, IFNGR2, IFNGR1, and TGFB1, persistent Rac1 and less suppressed STAT6 expression among the HI mice compared to shams.